|
|
Post by instaforexbella on Jun 13, 2024 2:25:18 GMT -5
Forex Analysis & Reviews: EUR/USD and GBP/USD: Technical analysis on June 13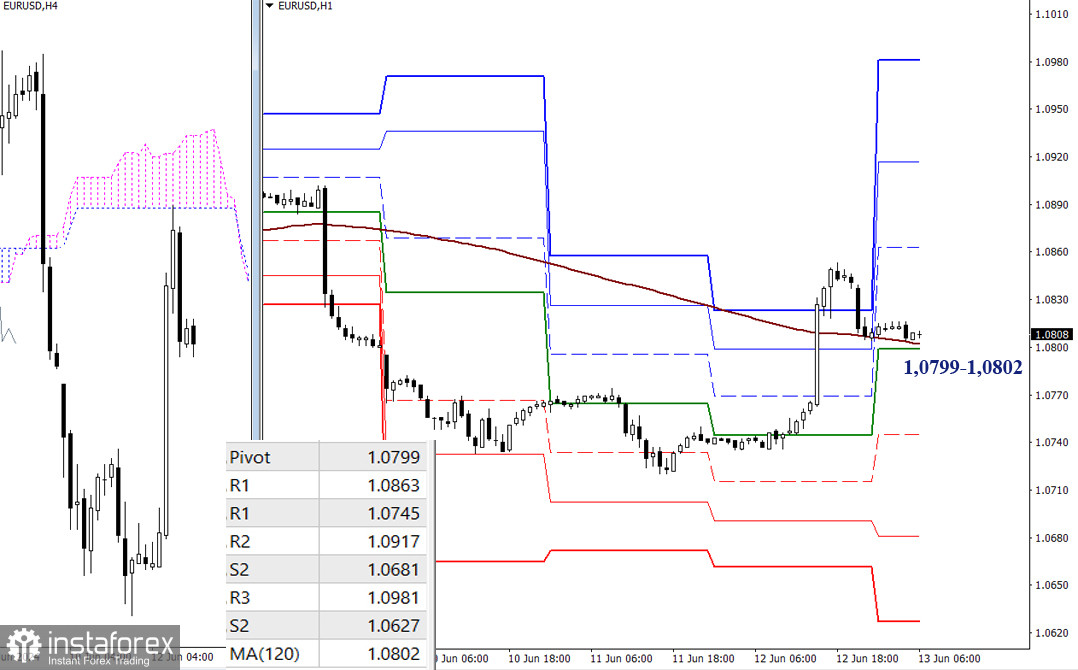 EUR/USD The bulls have returned to the area of different levels on the higher timeframes (1.0795 – 1.0829). These levels exert influence on the current situation's progress. The bulls' objective is to enter the positive territory relative to the weekly cloud (1.0862), which requires overcoming the cloud resistance of the weekly mid-term trend (1.0871). Afterwards, the bulls will focus on breaking through and eliminating the weekly Ichimoku dead cross (1.0934), after which new prospects will appear for them. GBP/USD 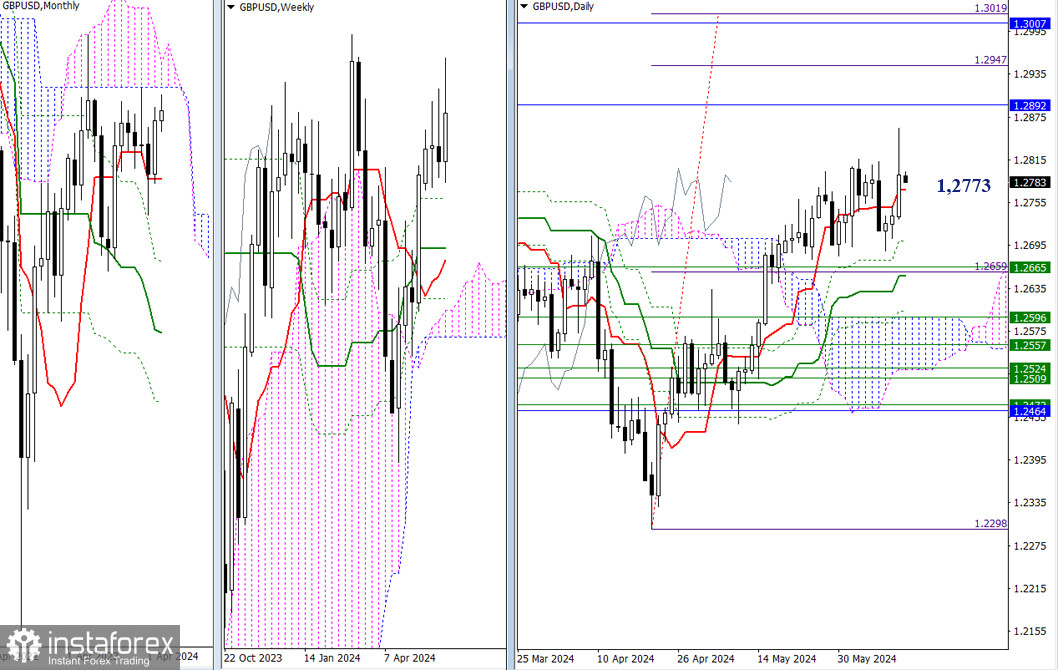 The bulls have updated the high, although they have not yet managed to close above it. The bullish prospects currently maintain their position and significance – the monthly cloud (1.2892 – 1.3007) and the daily target for breaking through the Ichimoku cloud (1.2947 – 1.3019). In case GBP/USD corrects lower, the first support levels that the market will encounter are from the daily Ichimoku cross (1.2773 – 1.2701 – 1.2652), reinforced by the weekly Fibonacci Kijun (1.2665). Analysis are provided by InstaForex. Read more: ifxpr.com/3VFDgZe
|
|
|
|
Post by instaforexbella on Jun 14, 2024 2:07:33 GMT -5
Forex Analysis & Reviews: Technical Analysis of Intraday Price Movement of Polkadot Cryptocurrency, Friday June 14 2024.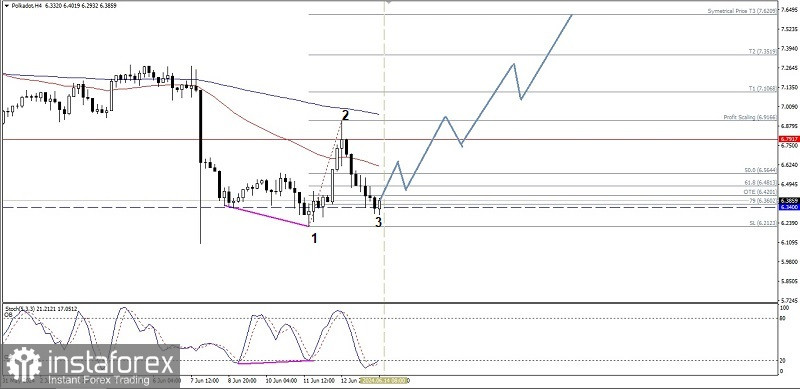 Currently, on the 4-hour chart of the Polkadot cryptocurrency, a Bullish 123 pattern appears followed by the appearance of deviations between price movements and the Stochastic Oscillator indicator, which indicates that in the near future there will be a strengthening correction in this cryptocurrency, whose main bias is currently still Bearish where this is indicated by the condition of the EMA 50 which is below the EMA 200 which is important as long as there is no weakening that penetrates below the level of 6.2123. This cryptocurrency has the potential to strengthen where the level that will be tested is 6.5644. If this level is successfully broken upwards then the next level will be The target is 6.7917, even if the momentum and volatility support it, it is not impossible that the level of 6.9166 will be the next target to be aimed at. Analysis are provided by InstaForex. Read more: ifxpr.com/45rsr0k
|
|
|
|
Post by instaforexbella on Jun 17, 2024 1:52:12 GMT -5
Forex Analysis & Reviews: Forecast of EUR/USD pair on June 17, 2024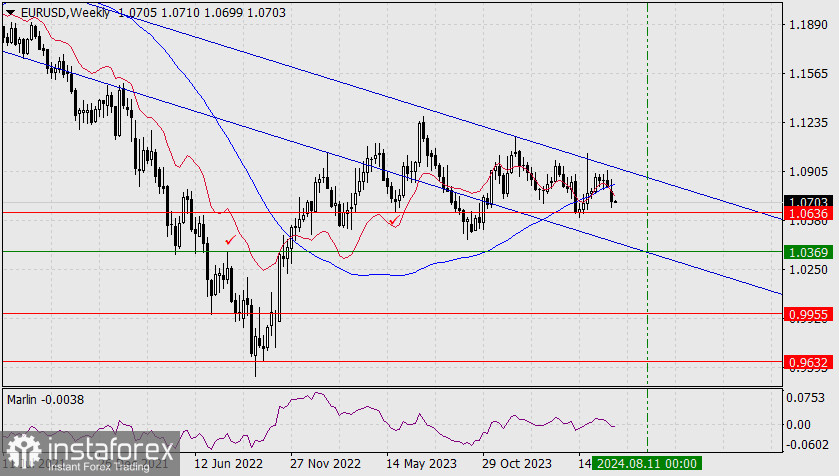 EUR/USD: The price has consolidated below the MACD indicator line (blue) and the balance indicator line (red) on the weekly chart. The Marlin oscillator has entered the territory of a downtrend. A fully downward trend of medium- and long-term nature has formed. The nearest target is the low of May last year at 1.0636, followed by the magnetic point we mentioned in previous reviews at 1.0369. The third target is 0.9955, the low of July 2022. 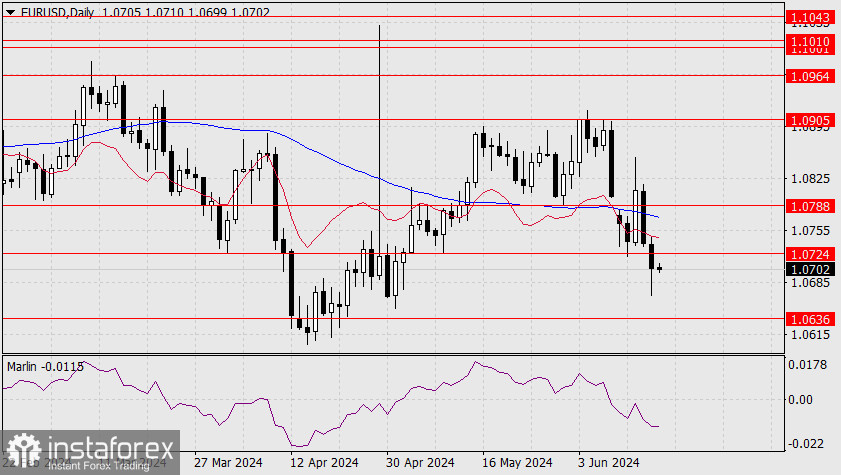 The price has consolidated below both indicator lines on the daily chart, with Marlin developing in the downward territory. The target of 1.0636 may be reached the day after tomorrow, after which a slight correction is likely 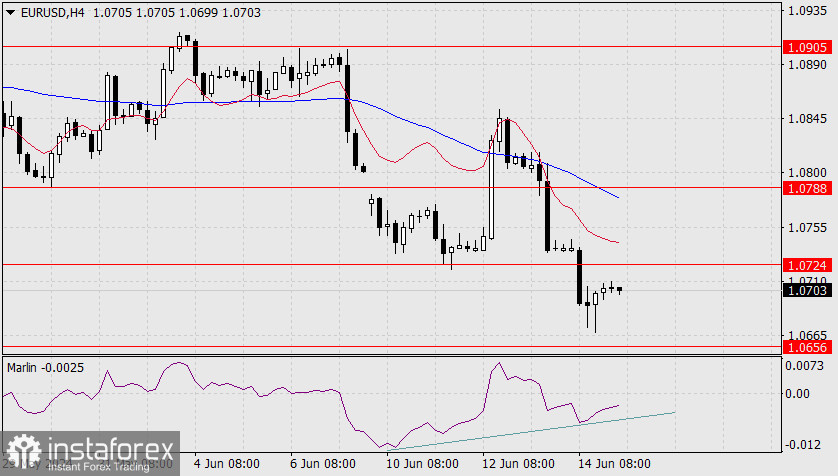 On the H4 chart, a convergence has formed between the price and the oscillator. This may indicate a price delay today. The limit of the corrective growth is at the level of 1.0724. Analysis are provided by InstaForex. Read more: ifxpr.com/3RwcDDs
|
|
|
|
Post by instaforexbella on Jun 18, 2024 2:22:41 GMT -5
Forex Analysis & Reviews: Forecast for GBP/USD on June 18, 2024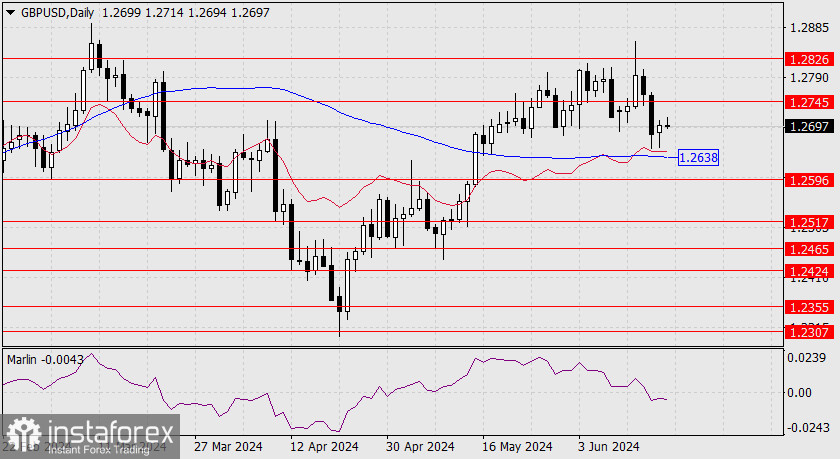 GBP/USD Yesterday, the British pound edged higher as the dollar index was down 0.23%. The pound is currently in a neutral state between the MACD line (1.2638) and the target resistance at 1.2745. 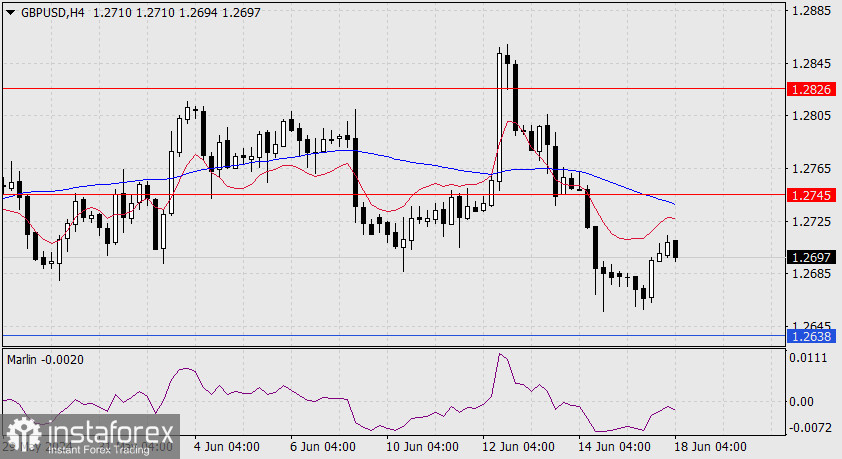 The Marlin oscillator, which is in bearish territory, is changing this neutral state towards a downward movement, prompting it to overcome the MACD line. Tonight, the U.S. will release reports on retail sales and industrial production. Forecasts are optimistic, suggesting that the pound will solidify its decision to decline. On the 4-hour chart, Marlin indicates a potential downturn without leaving the downtrend area. Overall, the progress over the last 14 candles happened beneath the balance and MACD indicator lines, indicating a downtrend. Even if the price reaches 1.2745, any form of rise will likely remain corrective in nature. Analysis are provided by InstaForex. Read more: ifxpr.com/4bnQr5T
|
|
|
|
Post by instaforexbella on Jun 19, 2024 2:23:05 GMT -5
Forex Analysis & Reviews: Forecast for EUR/USD on June 19, 2024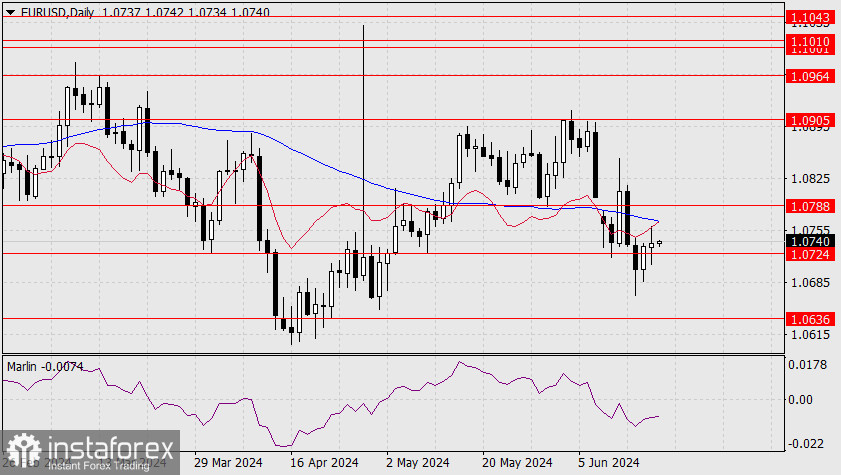 EUR/USD Yesterday, EUR/USD repeated the same pattern it showed on Monday, albeit in a weaker manner: in the face of muted growth in stock indexes and commodities, the European currencies edged slightly higher. The Australian dollar led gains by rising 42 pips. The euro had a volatile day but it still managed to close the day up 6 pips. The price failed to overcome the resistance of the daily balance indicator line. 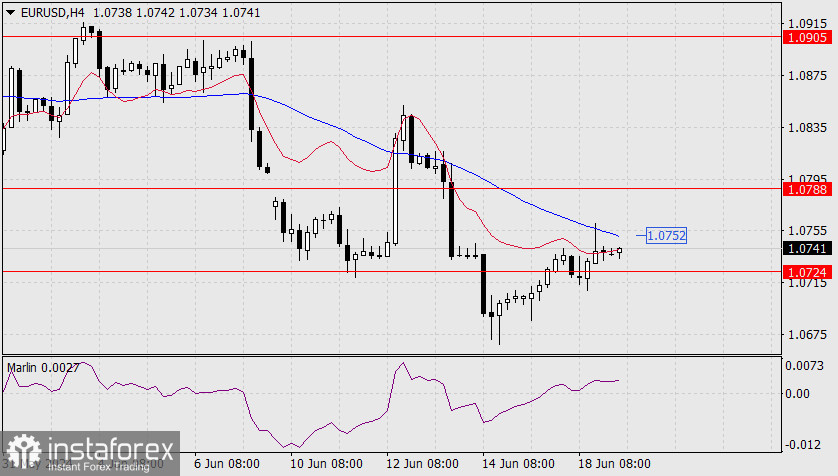 The Marlin oscillator is slightly turning around. The price may likely return below the level of 1.0724, where it closed yesterday. Breaking below yesterday's low of 1.0710 paves the way for the price to reach the bearish target of 1.0636, the May 2023 low. On the 4-hour chart, as expected, the MACD line stopped the euro from correcting higher. If the price manages to settle above this line (1.0752), it may even rise to 1.0788. However, the current situation suggests that the price may consolidate below 1.0724 and continue its descent towards 1.0636. Analysis are provided by InstaForex. Read more: ifxpr.com/4enpguF
|
|
|
|
Post by instaforexbella on Jun 20, 2024 2:11:15 GMT -5
Forex Analysis & Reviews: Technical Analysis of Intraday Price Movement of USD/CAD Commodity Currency Pairs, Thursday June 20 2024.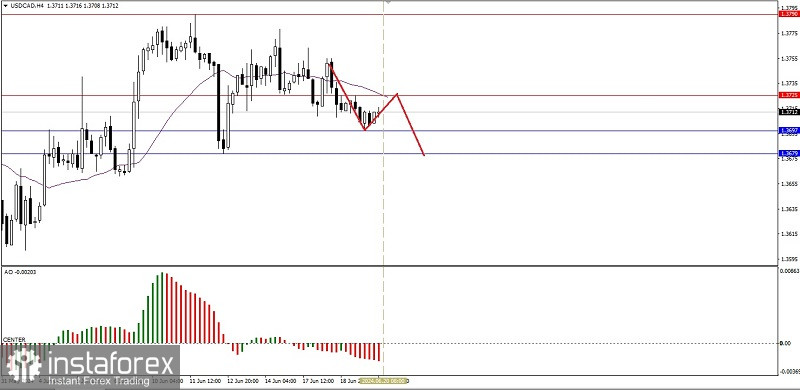 With the condition of The Lonnie's price movement which is below WMA 30 Shift 2 and the Awesome Oscillator indicator which is below level 0, it has the potential to cause USD/CAD to weaken down, where the level of 1,3697 will try to be tested in the near future. If this level is successfully broken below, the level of 1,3679 will become the next target to be aimed at, but if during the weakening journey a correction suddenly occurs where USD/CAD strengthens again, especially if it broken above the 1,3725 level, then all the weakening scenarios that have been described will become invalid and automatically cancel by themselves. Analysis are provided by InstaForex. Read more: ifxpr.com/4b9nSsI
|
|
|
|
Post by instaforexbella on Jun 21, 2024 3:02:12 GMT -5
Forex Analysis & Reviews: Forecast for EUR/USD on June 21, 2024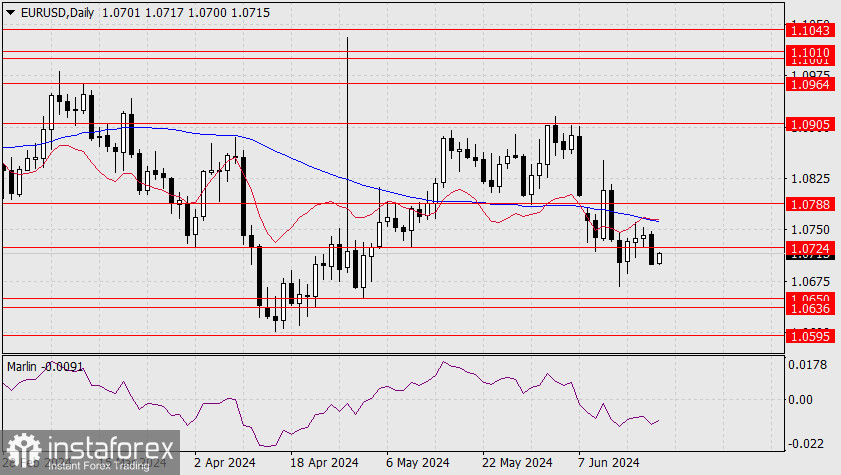 EUR/USD Yesterday, as expected, the euro traded lower after the pound fell due to the Bank of England meeting, and while the stock market also declined. The single currency lost 40 pips, breaking through the support at 1.0724. The target range of 1.0636/50 is now open, but we expect the euro to surpass this range and head towards 1.0595. If the price gains momentum, it may even reach 1.0520. 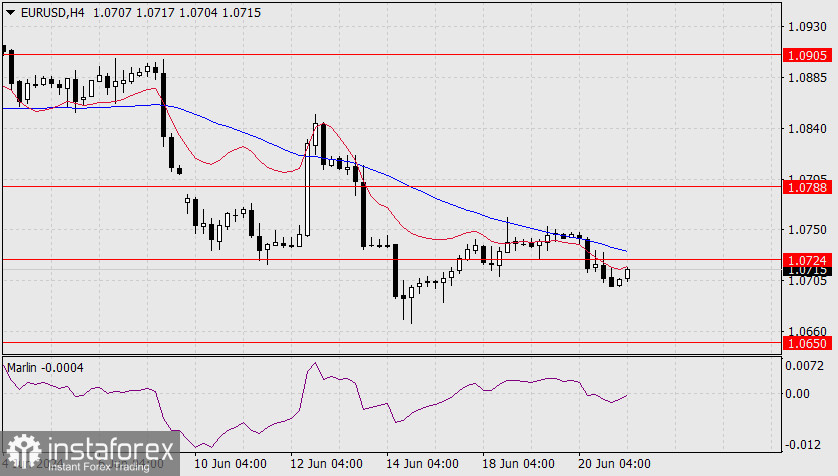 The euro cannot fall rapidly due to the commodity markets, which showed good growth yesterday, but it received support from the Swiss National Bank, which unexpectedly lowered its rate from 1.50% to 1.25%, surprising market participants. Also, the US released weak economic indicators on Thursday. Today's economic reports do not bode well for the dollar; the Eurozone composite PMI is forecasted to increase from 52.2 to 52.5 in June, while the PMI for the US services sector is expected to fall from 54.8 to 53.7. On the 4-hour chart, the price turned down from the resistance of the MACD line. After this reversal, the price settled below the balance line, and the Marlin oscillator settled below the zero line. The trend has turned bearish on both charts, but a notable decline will likely occur next week. Analysis are provided by InstaForex. Read more: ifxpr.com/3KTrW5z
|
|
|
|
Post by instaforexbella on Jun 24, 2024 6:48:59 GMT -5
Forex Analysis & Reviews: EUR/USD. June 24th. Friday remained for the bears, but the bulls went on the attack on Monday The EUR/USD pair on Friday made a reversal in favor of the US dollar around the corrective level of 61.8%-1.0722, and dropped to the Fibonacci level of 76.4%-1.0676. Such a movement was expected. The rebound of the pair from the level of 1.0676 already worked in favor of the European currency and started to rise towards the level of 1.0722. A rebound today from this level will return the pair into "bearish hands" with a potential drop back to 1.0676. Firming above the level of 1.0722 will increase the probability of further growth towards the next corrective level of 50.0%-1.0760.  The wave situation remains clear. The last completed upward wave turned out to be very weak and failed to break the peak of the previous wave. The last downward wave (which may still need to be completed) also failed to break the low of the previous wave. Thus, the "bearish" trend persists, but in the near future, the first sign of a trend change to "bullish" may appear. This sign will be a breakthrough of the peak of the last upward wave from June 18th. If this does not happen, I will expect a return to the level of 1.0676. The information background on Friday influenced traders' sentiment, but I cannot say it was strong. Business activity indices in the European Union and Germany turned out to be weaker than traders' expectations, which led to selling the pair in the first half of the day. American business activity indices were slightly better than forecast, but bears failed to overcome the level of 1.0676, so the decline did not continue. The combination of graphical and information analysis worked quite well on Friday. The further prospects of the EUR/USD pair depend more on graphical analysis, as the information background this week will be relatively weak. On the 4-hour chart, the pair has made a new reversal in favor of the euro after forming a "bullish" divergence on the CCI indicator. The quotes have retraced to the Fibonacci level of 61.8%-1.0714, but I still do not believe in a long-term rise of the euro. Last week, on the 4-hour chart, there was a close below the trend line, which changed traders' sentiment to "bearish". Therefore, I expect a small (in strength) correction now, followed by a resumption of the "bearish" trend. I recommend using levels from the hourly chart at the moment. Analysis are provided by InstaForex. Read more: ifxpr.com/4czkg42
|
|
|
|
Post by instaforexbella on Jun 25, 2024 3:10:28 GMT -5
Forex Analysis & Reviews: Forecast for GBP/USD on June 25, 2024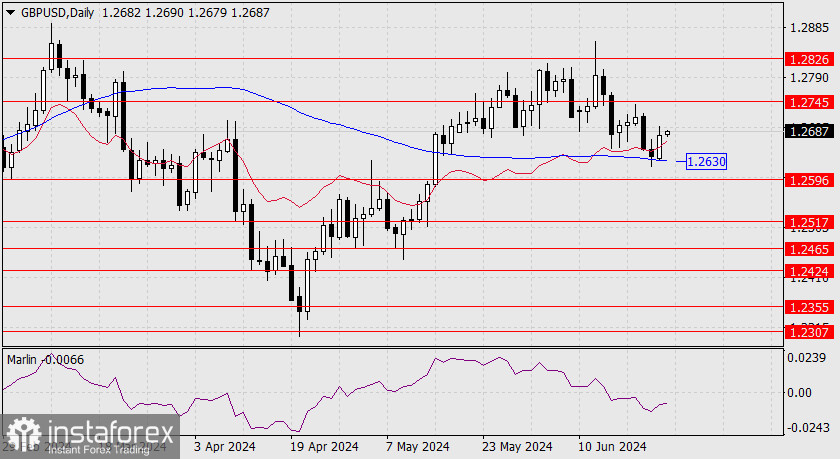 GBP/USD Yesterday, the pound sterling rebounded from the support of the daily MACD line and gained 40 pips by the end of the day. Now the price is rising above the balance line (red moving average) with the support of the rising Marlin oscillator. The signal line of the oscillator will reach the zero line – the boundary of the uptrend territory – around the time the price hits the target level of 1.2745. In this case, a breakout point will be created, from which the trend will either turn into a medium-term decline or it could strengthen the growth to the target of 1.2826, with the possibility of reaching 1.2940. The main scenario is a downward movement. On the 4-hour chart, the emerging convergence that was outlined yesterday has finally materialized, and the pound's corrective growth has reached the MACD line. There is a possibility that the price will not be able to consolidate above this line, so a scenario where the price reverses from current levels without breaking above yesterday's high is also possible. The pound will confirm a downward movement when the quote breaks below the daily MACD line, below the 1.2630 level. Analysis are provided by InstaForex. Read more: ifxpr.com/3VYX6yV
|
|
|
|
Post by instaforexbella on Jun 26, 2024 1:01:57 GMT -5
Forex Analysis & Reviews: Forecast for EUR/USD on June 26, 2024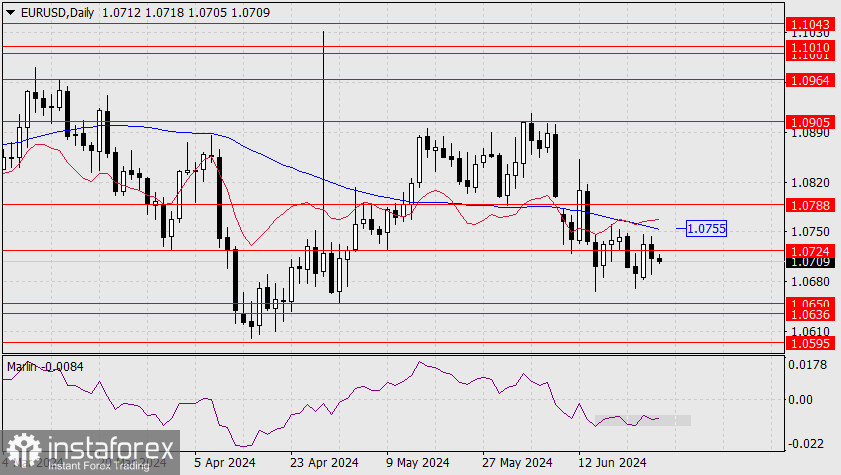 EUR/USD Time is currently working against the euro. If the single currency does not test the MACD line (1.0755) on the daily timeframe within the next two days, the technical situation will no longer allow for such a scenario. 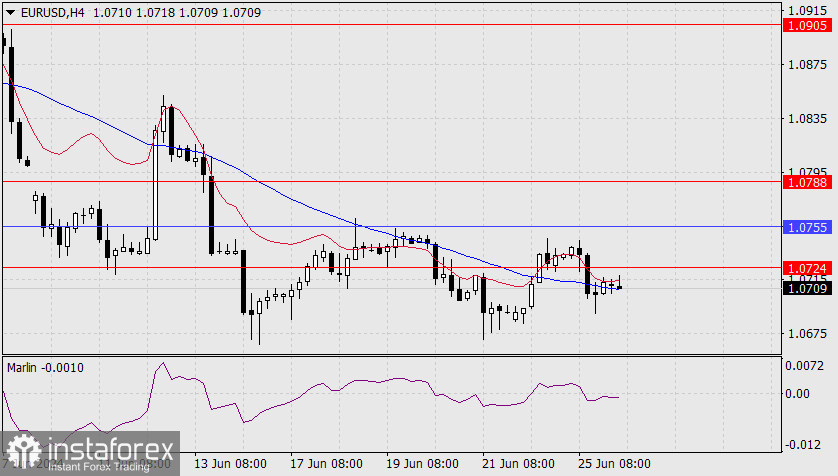 At the moment, if the price breached yesterday's low at 1.0691, it will move towards the target range of 1.0636/50 and further towards 1.0595. The Marlin oscillator is currently within a narrow sideways range (grey area), maintaining a neutral position and this gives the price a chance to test 1.0755. On the 4-hour chart, the price has settled below the level of 1.0724 and is entangled around the MACD line. The Marlin oscillator has settled on a downward trajectory. We're waiting for the price to break yesterday's low and further progress on the decline according to the main scenario. Analysis are provided by InstaForex. Read more: ifxpr.com/3xAo6eI
|
|
|
|
Post by instaforexbella on Jun 27, 2024 4:37:19 GMT -5
Forex Analysis & Reviews: USD/JPY: trading tips for beginners for the European session on June 27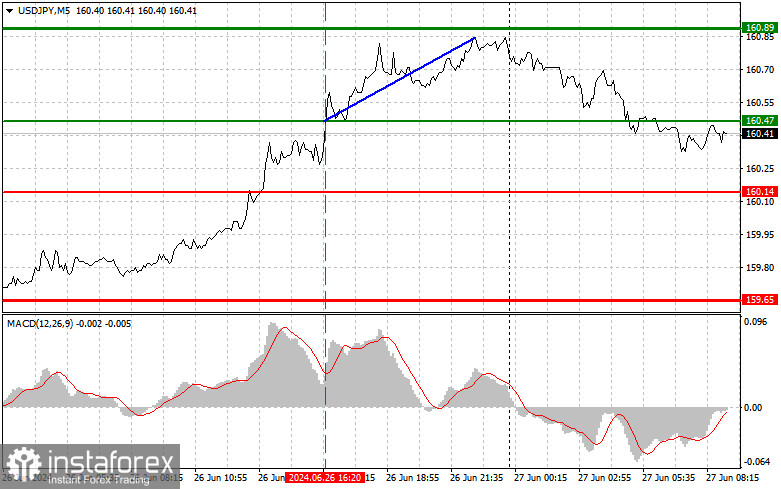 Overview of trading and tips on USD/JPY The price test of 160.47c occurred when the MACD indicator started to rise from the zero mark, which confirmed the correct entry point to buy the dollar during the ongoing bull market. As a result, the pair rose by more than 40 pips, in continuation of testing annual highs. As we can see, traders are completely ignoring weak data on the American economy and continue to actively put pressure on the Japanese yen, taking advantage of the significant difference in interest rates and the policies conducted by the central banks. It is unlikely that anything will change today, so it is better to rely on potential pullbacks and continue buying the dollar. As for the intraday strategy, I will rely more on the implementation of scenarios No. 1 and 2. 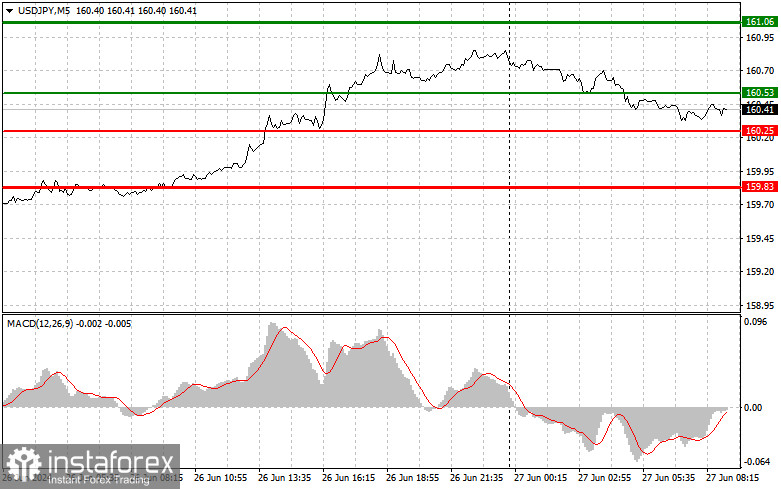 What's on the chart: The thin green line is the entry price at which you can buy the trading instrument. The thick green line is the estimated price where you can set Take-Profit (TP) or manually close positions, as further growth above this level is unlikely. The thin red line is the entry price at which you can sell the trading instrument. The thick red line is the price where you can set Take-Profit (TP) or manually close positions, as further decline below this level is unlikely. MACD line: it is important to be guided by overbought and oversold areas when entering the market Important: Novice traders in the forex market need to be very careful when making decisions to enter the market. It is best to stay out of the market before important fundamental reports are released to avoid getting caught in sharp price fluctuations. If you decide to trade during news releases, always place stop orders to minimize losses. Without setting stop orders, you can quickly lose your entire deposit, especially if you don't use money management and trade in large volumes. And remember, for successful trading, it is necessary to have a clear trading plan, similar to the one I presented above. Spontaneously making trading decisions based on the current market situation is inherently a losing strategy for an intraday trader. Analysis are provided by InstaForex. Read more: ifxpr.com/4cgtHFT
|
|
|
|
Post by instaforexbella on Jul 1, 2024 3:58:27 GMT -5
Forex Analysis & Reviews: EUR/USD and GBP/USD: Technical analysis on July 3 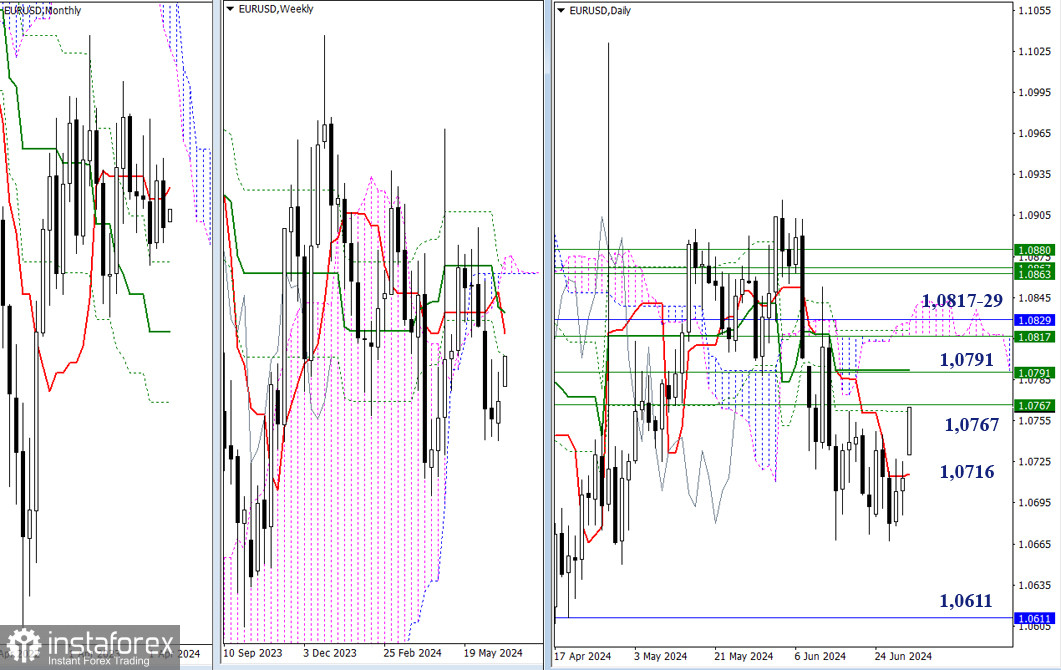 EUR/USD Higher timeframes Earlier, the market remained uncertain. With the start of a new week and month, a significant bullish gap has formed, followed by a sustained rise. Currently, the pair has reached the resistances of the daily (1.0762) and weekly (1.0767) Fibonacci Kijun levels. If the bullish bias remains intact and the pair breaks through these resistances, the next target will be the 1.0791 mark, which currently combines the daily mid-term trend and the weekly short-term trend. After this, the bulls will be drawn to the cluster of levels around 1.0817-29 (weekly mid-term trend + monthly short-term trend + daily cloud). For the bears, under the current conditions, breaking the support of the daily short-term trend (1.0718) and testing the low (1.0667) will be significant. 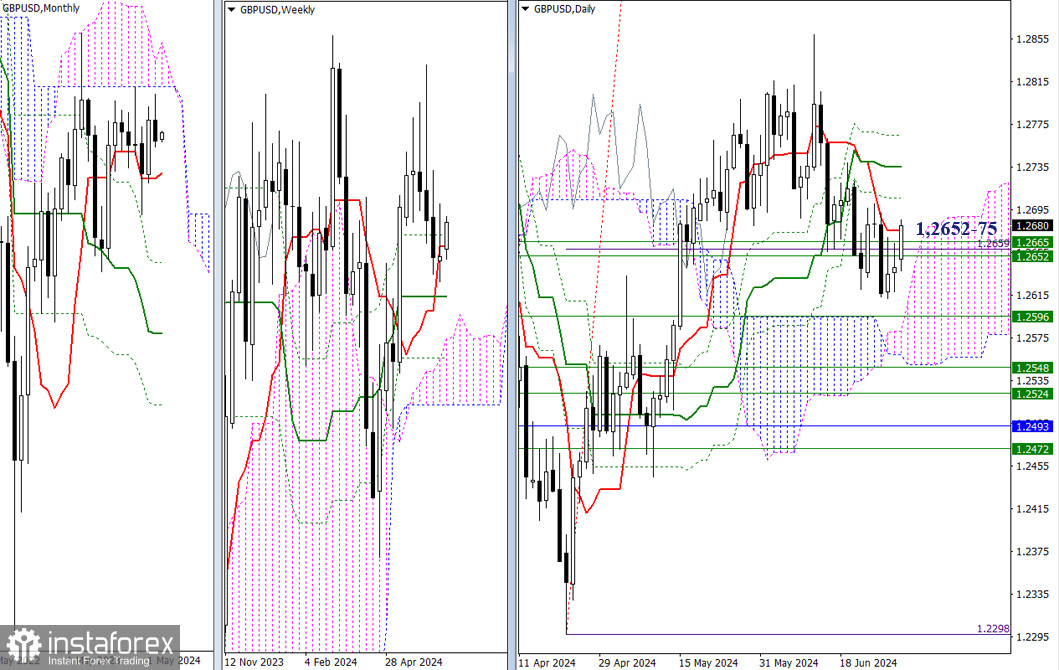 GBP/USD Higher timeframes GBP/USD ended the previous month in the area of uncertainty and consolidation. The weekly and daily time frames are forming and confirming the monthly sentiment. Currently, there is interaction with the weekly levels (1.2652-65) and the daily short-term trend (1.2675). The outcome will determine the further development of events. If the bulls prevail, the market will first focus on overcoming the resistances of the daily Ichimoku dead cross (1.2706 – 1.2736 – 1.2765). However, if the bearish bias proves stronger and the market returns below the weekly levels (1.2652-65), then the area of 1.2608 – 1.2596 (upper boundary of the daily cloud + weekly mid-term trend) will become significant. Analysis are provided by InstaForex. Read more: ifxpr.com/4cGvOTb |
|
|
|
Post by instaforexbella on Jul 2, 2024 1:45:48 GMT -5
Forex Analysis & Reviews: Forecast for EUR/USD on July 2, 2024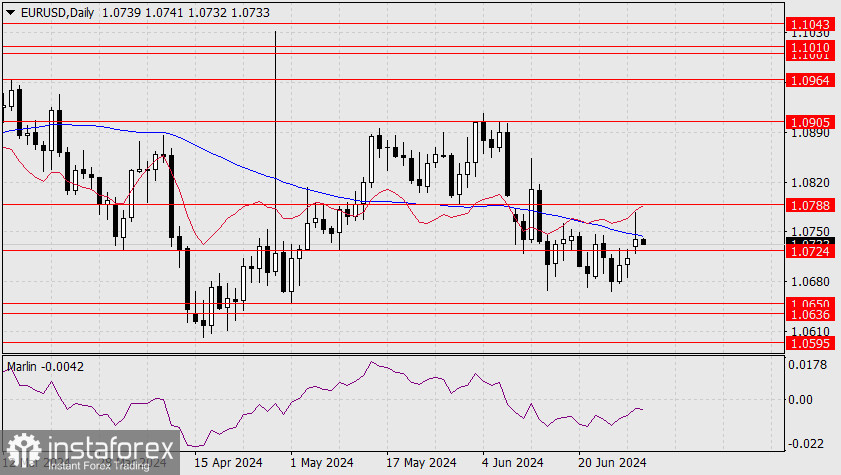 EUR/USD Yesterday, the euro closed below the Kijun-sen line with a large upper shadow. The euro has failed to reach the target level of 1.0788, and it is likely on track to close the gap below the 1.0724 level. However, all these actions are taking place within the framework of waiting for the upcoming holiday on Thursday and the key US employment data on Friday, which is the main event of the week. 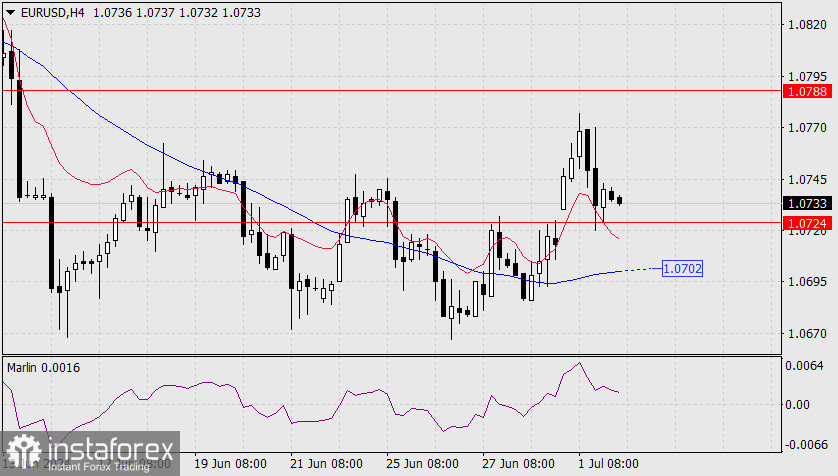 The forecast for new non-farm payroll jobs in June is 189,000 compared to 272,000 in May. However, the negative trend in the overall number of unemployed last month (Continued Jobless Claims) suggests a worse non-farm payroll figure, around 150,000-160,000, similar to what we saw in November last year when the structure of Continued Jobless Claims was similar. In such a case, the euro might fall along with the stock market due to a risk-off effect. On the 4-hour chart, the euro seems to be trying to retest the support at 1.0724. If the euro intends to close the gap, it can breach this support level. We can confirm the euro's intention to continue the downward movement when the price consolidates below the Kijun-sen line (1.0702). By that time, the Marlin oscillator will likely be in the downtrend territory (below the zero line). Analysis are provided by InstaForex. Read more: ifxpr.com/4clZfdN
|
|
|
|
Post by instaforexbella on Jul 3, 2024 5:14:48 GMT -5
Forex Analysis & Reviews: Hot forecast for EUR/USD on July 3, 2024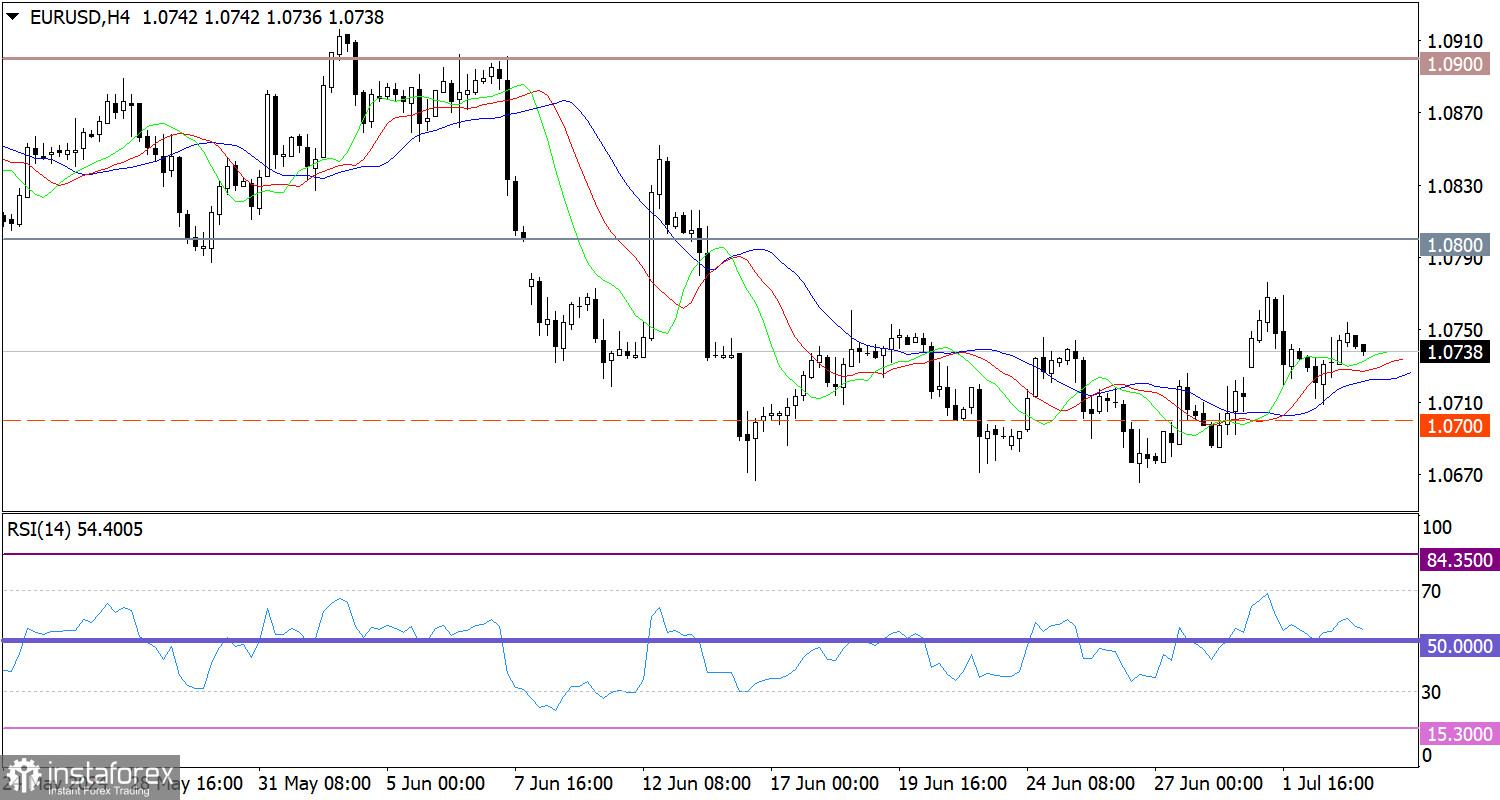 As expected, Eurozone inflation slowed to 2.5% in June from 2.6% a month earlier, but this did not affect the market since investors have long been anticipating further interest rate cuts by the European Central Bank. But the fact that the Eurozone unemployment rate remained unchanged, instead of increasing from 6.4% to 6.5%, left an impact on the market. As a result, the euro rose to the upper boundary of the narrow range, although it was quite a modest rise. The pair wouldn't be able to break out of this range today. Investors are eagerly awaiting the U.S. Department of Labor report, which is set for release on Friday. Until then, no one is willing to take risks. Furthermore, today is a short trading day in the United States due to the Independence Day celebrations tomorrow. Given that the single currency is near the upper boundary of the range, it is more likely for the pair to gradually move towards the lower boundary. However, we don't expect the price to reach this mark. Market activity on Wednesday is expected to be quite low. The euro slightly strengthened against the US dollar, but no significant price changes were observed. The pair continues to move within the range of 1.0670/1.0750, with particular focus on the upper boundary. On the 4-hour chart, the RSI technical indicator is hovering in the upper area of 50/70, which indicates a bullish bias. Meanwhile, on the same chart, the Alligator's MAs are within the horizontal channel, but are heading upwards. Outlook Movement within the horizontal channel is temporary. The main strategy is to strengthen trading positions the moment the flat phase ends. We can confirm that the phase has ended once the price settles beyond either boundary of the range in the intraday period. In terms of complex indicator analysis, the short term period indicates a bearish bias, while the residual effect of the upward movement remains in the intraday period. Analysis are provided by InstaForex. Read more: ifxpr.com/3xIpuvF
|
|
|
|
Post by instaforexbella on Jul 5, 2024 4:06:04 GMT -5
Forex Analysis & Reviews: USD/JPY: trading tips for beginners for the European session on July 5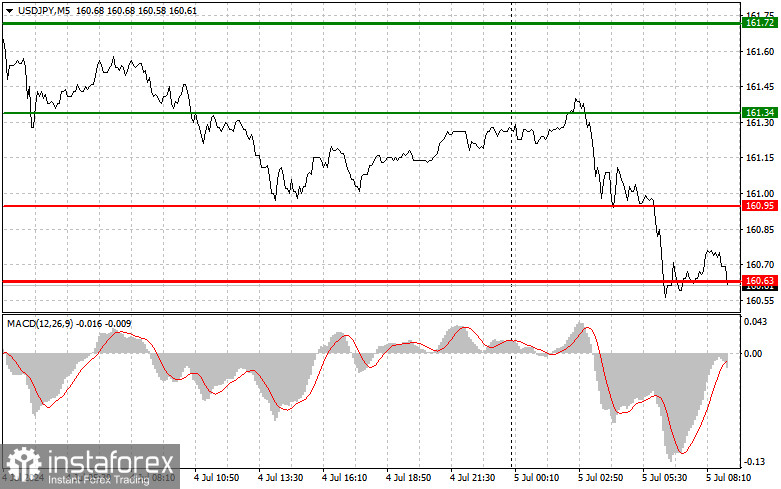 Overview of trading and tips on USD/JPY There were no price tests of the levels I mentioned in the U.S. session, so we did not get any good entry points. The U.S. holiday was the main reason why volatility was low. Despite the circumstances, sellers were determined to trade actively in today's Asian session, which led to the test of the weekly lows. Even weak data on household spending, which sharply decreased, did not hinder the pair's correction. The figures for the index of leading economic indicators matched economists' forecasts, but traders ignored this report. It is clear that the pair's further direction will entirely depend on the U.S. labor market data, and until then, we are unlikely to see a breakout and consolidation below the daily low. For this reason, I will try to look for reversal entry points, in anticipation of a small bullish correction. As for the intraday strategy, I will rely more on the implementation of scenarios No. 1 and 2. Buy signals Scenario No. 1. Today, I plan to buy USD/JPY when the price reaches the entry point at 160.89 plotted by the green line on the chart, aiming for growth to 161.46 plotted by the thicker green line on the chart. Around 161.46, I'm going to exit long positions and open short ones in the opposite direction, expecting a movement of 30-35 pips in the opposite direction from that level. You can count on the pair to rise today after actively defending the intraday low. Before buying, make sure that the MACD indicator is above the zero mark and is just starting to rise from it. Scenario No. 2. I also plan to buy USD/JPY today in case of two consecutive tests of 160.52 when the MACD indicator is in the oversold area. This will limit the pair's downward potential and lead to a reverse market upturn. One can expect growth to the opposite levels of 160.89 and 161.46. Sell signals Scenario No. 1. I plan to sell USD/JPY today only after testing the level of 160.52 plotted by the red line on the chart, which will lead to a rapid decline in the price. The key target for sellers will be 159.95, where I am going to exit short positions and immediately open long ones in the opposite direction, expecting a movement of 20-25 pips in the opposite direction from that level. Pressure on USD/JPY may return at any moment within the bearish correction. Before selling, make sure that the MACD indicator is below the zero mark and is just starting to decline from it. Scenario No. 2. I also plan to sell USD/JPY today in case of two consecutive price tests at 160.89 when the MACD indicator is in the overbought area. This will limit the pair's upward potential and lead to a reverse market downturn. One can expect a decline to the opposite levels 160.52 and 159.95. Analysis are provided by InstaForex. Read more: ifxpr.com/3XQopMT
|
|