|
|
Post by instaforexgertrude on Apr 25, 2018 23:27:09 GMT -5
Gold fell under the crossfireAfter the unsuccessful attempt to breakthrough the upper border of the medium-term trading range of $ 1300-1360 per ounce, the gold collapsed downwards on an unfavorable external background. The topic of the trade war in the context of rapid negotiations between Washington and Beijing no longer provides support for safe havens, while the shift in investors' interest in tightening monetary policy of the Federal Reserve extended a helping hand to the rates of the debt market and the US dollar. Precious metals reacts sensitively to the behavior of these assets: the strengthening of the US currency makes imports in the largest consumer countries of the physical asset more expensive. At the same time, non-yielding gold is not able to adequately compete with treasury bonds in the event of an increase in yield. Dynamics of the yield of US and gold bonds 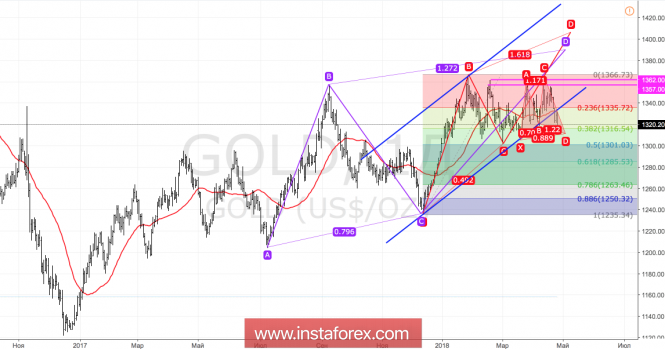 The growth of rates in the 10-year American debts above the psychologically important level of 3% to the maximum level since the beginning of 2014 has become a real catastrophe for the "bulls" of XAU/USD. Moreover, increasing the attractiveness of bonds leads to the diversification of investment portfolios in their favor, so the cost of servicing ETF products is even more expensive. But in April, according to Commerzbank, the reserves of specialized funds increased by 53 tons, which is equivalent to all inflows for the first quarter. Uncertainty about the US-China trade conflict, geopolitical problems in the Middle East and the reluctance of the US dollar to strengthen in response to the Fed's "hawkish" rhetoric have inflated the demand for these assets, but at the end of April the external background has radically changed. This can lead to loss of the ETF. In general, it seems that 2015-2016 has returned, when rumors about the normalization of the monetary policy of the Fed pushed up the USD index. In April, the chances of four federal funds rate increases in 2018 increased from less than 30% to almost 50%, which is one of the main drivers of growth in Treasury yields. The second is the increase in inflation expectations under the influence of the Brent rally to $75 per barrel. Not the least role in the correction of the USD index is the weakness of the euro on the eve of the meeting of the Governing Council. The ECB is concerned about the impact of the revaluation of the single European currency and trade conflicts on the eurozone economy. The latter lost steam in the first quarter, however, its gradual recovery during the rest of the year will return to the market rumors about the normalization of the ECB monetary policy and will help restore the EUR/USD position. Gold will be able to benefit from this fact due to its high correlation with the US dollar. Technically there is a retest of the lower border of the upward trading channel. If the "bulls" manage to return gold quotes into it and consolidate above the resistance at $1336 per ounce, the risks of recovery of the upward trend will increase. On the contrary, if the buyers do not succeed, the peak of the precious metal in the direction of targeting by 88.6% in the pattern of the "Shark" is likely to continue. Gold, daily chart Analysis are provided byInstaForex.
|
|
|
|
Post by instaforexgertrude on Apr 27, 2018 0:06:13 GMT -5
The ECB leaves the rate unchanged, and Draghi leaves the answersThe euro fell in the morning against the US dollar, but did not go beyond the lows. Pressure on the pair had data from the company GfK, according to which the mood of consumers in Germany in May will deteriorate. This will happen because of fears about the geopolitical risks and the growth of protectionism, which the US is promoting with respect to trade. As indicated in the leading report, the index of consumer confidence in Germany in May was 10.8 points against 10.9 points in April. The data fully coincided with the forecasts of economists. After the publication of the ECB's decision on the interest rate, the euro again returned to the lows of the day. Thus, the European Central Bank left the refinancing rate unchanged, at 0.0%, while the deposit rate was also maintained at a negative level of -0.4%. 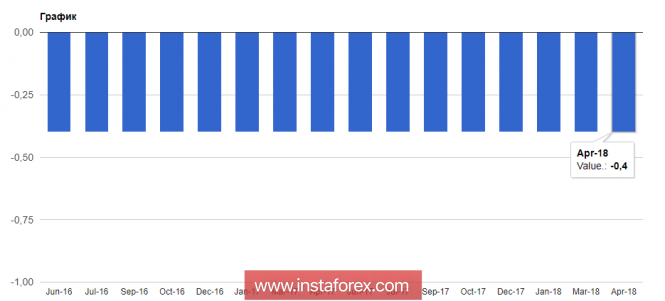 The ECB said that rates will remain at current levels for an extended period, especially highlighting the point that changes in monetary policy will not be introduced long after the completion of asset purchases. Let me remind you that a number of experts suggest that as soon as the European regulator completely turns off the asset buy-back program, there will immediately appear the prerequisites for raising interest rates. As for the program of quantitative easing, then, according to the ECB, it will be implemented in the amount of 30 billion euros a month before the end of September this year, and if necessary, then longer. The ECB President's speech at the press conference led to a surge in market volatility. Many market participants expected specifics in the statements of the ECB President regarding the asset buy-back program. Despite this, Mario Draghi again blurrily commented on the current situation. According to him, the incoming information speaks in favor of a somewhat moderate position. With regard to the rate of price growth, Draghi expressed concern about the restrained growth of core inflation, confident that inflation will continue to rise to the target level in the medium term, and that it will still require significant stimulus to maintain it. Draghi also drew attention to the fact that economic growth will remain confident, large-scale, even though the growth rate has become more moderate compared to the beginning of 2018. In this connection, according to the president of the ECB, there remains a need for sufficient monetary and credit incentives. Analysis are provided byInstaForex.
|
|
|
|
Post by instaforexgertrude on May 2, 2018 0:33:35 GMT -5
Technical analysis: Intraday Level For EUR/USD, May 02, 2018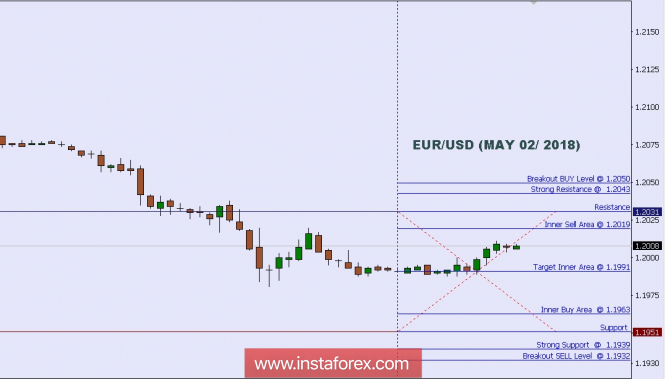 When the European market opens, some Economic Data will be released such as Unemployment Rate, Italian Prelim GDP q/q, Prelim Flash GDP q/q, Italian Monthly Unemployment Rate, Final Manufacturing PMI, Final Manufacturing PMI, French Final Manufacturing PMI, Italian Manufacturing PMI, and Spanish Manufacturing PMI. The US will release the Economic Data too, such as Federal Funds Rate, Crude Oil Inventories, and ADP Non-Farm Employment Change, so, amid the reports, EUR/USD will move in a medium to high volatility during this day. TODAY'S TECHNICAL LEVEL: Breakout BUY Level: 1.2050. Strong Resistance:1.2043. Original Resistance: 1.2031. Inner Sell Area: 1.2019. Target Inner Area: 1.1991. Inner Buy Area: 1.1963. Original Support: 1.1951. Strong Support: 1.1939. Breakout SELL Level: 1.1932. Analysis are provided byInstaForex.
|
|
|
|
Post by instaforexgertrude on May 3, 2018 0:11:15 GMT -5
Gold tests advisorThe dollar rose from its knees and the yield of 10-year US Treasuries broke through a psychologically important mark of 3%, which made gold a whipping boy. The precious metal fell to the level of 4-month lows, and the market is discussing the prophetic forecast of Larry Kudlow. When assuming the post of chief economic advisor to the president, he recommended buying the US dollar and selling gold. By that time, and the case was in mid-March, the USD index lost about 8.6%, while the XAU/USD, by contrast, added 8.8%, so Kudlow's advice at best was puzzling. In fact, everything turned out differently. The Economic Adviser proved his professionalism. A great start, Larry! Dynamics of gold and the US dollar 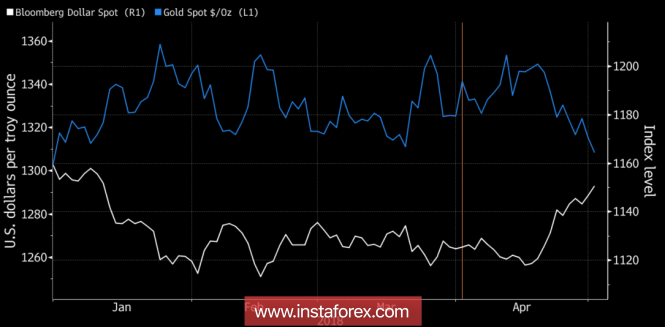 Someone perceived the success of the replacement Gary Cohen as an accident (once a year and a stick shoots), someone - a confirmation of the theory that markets are ruled by people from Washington, whether the Fed or the US administration. Much more important is another - the precious metal and the dollar continue to walk in pairs, although in different directions. The gold is traditionally perceived as a hedge against inflation, but always take into account the dynamics of real rates of the US debt market. The rapid growth in the yield of treasury bonds caused no less a blow to the positions of the "bulls" in the XAU/USD than the "greenback" who rose from the ashes. The precious metal is unable to compete with bonds because of its inability to pay dividends, so it fell into disgrace. Stocks of the world's largest specialized stock exchange fund SPDR Gold Trust fell to 866.77 tons, while XAU/USD prices fell to the lowest level since the end of December. Gold as easily slid into the red zone from the beginning of the year, as it started to kick off. What can save it? Short-term - the absence of signals from the Fed on four hikes in the federal funds rate in 2018 and disappointing statistics on the US labor market for April. Mid-term - the restoration of the global economy after a disastrous first quarter. Do not be surprised that the safe-haven will respond positively to an improvement in the global appetite for risk. In fact, the scheme "overclocking the US economy - increasing the growth rate of global GDP - the normalization of monetary policy by central banks-competitors of the Fed" can cause a re-earn, which will lead to a weakening of the dollar and a return to interest in gold. Investors should closely monitor the ability of the yield of 10-year US bonds to break the level of 3%, and gain a foothold above it. It does not work out - large accounts will begin to record profits on long positions in US currency. The technically formed pattern of the "Broadening Wedge" pattern and the transformation of the "Shark" pattern into a 5-0 increase the risks of a pullback in the direction of 23.6%, 38.2% and 50% of the CD wave. Correction, as a rule, is used for selling, however, if bulls on gold manage to return quotes to the resistance at $1352 and $1359 per ounce, the risks of recovery of the upward trend will increase.т. Gold, daily chart 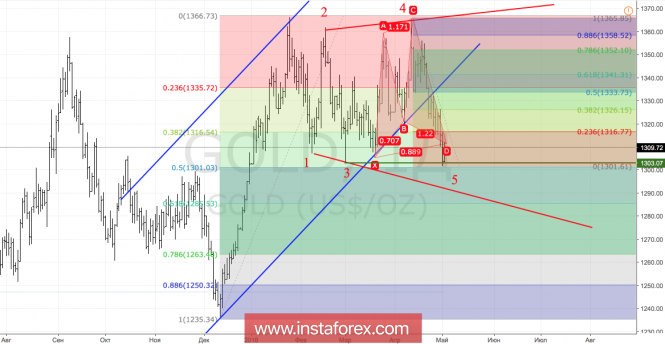 Analysis are provided byInstaForex. Analysis are provided byInstaForex.
|
|
|
|
Post by IFX Yvonne on May 4, 2018 4:59:02 GMT -5
Technical analysis on USDX for May 4, 2018 The Dollar index has broken out of the bullish channel. Price has been giving bearish divergence signs in the RSI for the last few days while it was making higher highs and higher lows. With Non Farm Payrolls expected today, traders should be very cautious and wait to act until after the announcement. 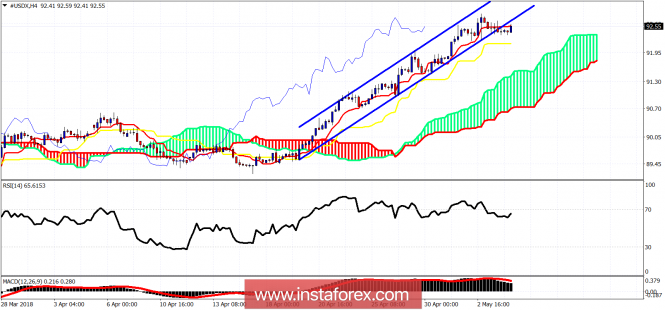 Blue lines - bullish channel The Dollar index above the Ichimoku cloud. Trend remains bullish. However we have two warning signs. The break below the channel and the bearish divergence in the RSI. Short-term support is at 92.15 and next at 91.40. I expect a major trend reversal to occur today or early next week to the downside. I would not be buying the index around current levels but look for selling. *The market analysis posted here is meant to increase your awareness, but not to give instructions to make a trade.
|
|
|
|
Post by instaforexgertrude on May 8, 2018 0:41:13 GMT -5
Pound keeps gunpowder dryLooking at the dynamics of the British pound in the last two weeks, "bulls" are really sorry. Excessive euphoria after the announcement of the transition period between the UK and the EU and the "hawkish" speeches by representatives of the Bank of England allowed the GBP/USD pair to climb to a peak since the referendum on membership in the European Union. Many forecasters saw sterling at $1.45 and higher by the end of the year, but the reality turned out to be harsh. Disappointing statistics and a surprise from Mark Carney is a cold shower spilled on the heads of the pound fans. From the levels of the April highs, it lost about 6% of its value. British tabloids love to criticize foreign players. Therefore, the speech of the Canadian nationality of Carney that BoE has other meetings to talk about raising the REPO rate was interpreted as cowardice. The subsequent negative from GDP for the first quarter and from business activity in April reduced the chances of a tightening of monetary policy from 90% to 10% in May. Is it possible to resist such a background sterling? The dynamics of the likelihood of an increase in the REPO rate in May 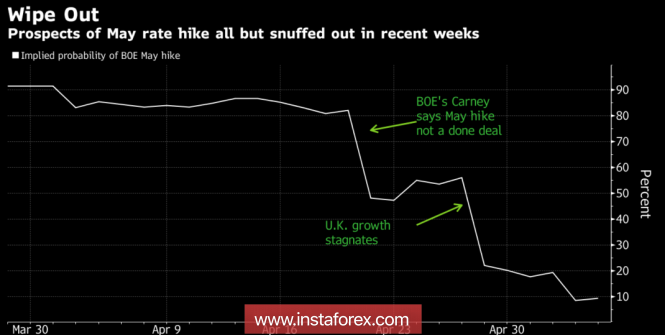 The US dollar rose from the ashes to the fire. The US currency is attacking the entire front of the market due to the growth of the yield of treasury bonds and the large-scale winding up of record speculative net-euros. The slowdown of the eurozone's GDP affects the economy of the UK. Is it worth to blame Mark Carney for cowardice? The departure of inflation from the 3% mark and the weak macroeconomic statistics on industrial production, retail sales, GDP and other indicators compel the Bank of England to keep its powder dry. The final touch was the release of data on business activity in the service sector, which accounts for about 80% of UK GDP. The purchasing managers' index rose from a 20-month low of 51.7 to 52.8 in March, but did not reach the forecasts of Bloomberg experts. And yet BofA Merrill Lynch recommends its clients - "bears" - to be cautious. The Bank of England does not refrain from normalizing monetary policy, which, together with a reduction in political risks, should support the sterling. The National Institute of Economic and Social Research predicts that the REPO rate will be raised in August, and during the remainder of the year GDP growth will be about 1.7%. Most likely, on May 10, Mark Carney and his colleagues will decide to retain the previous parameters of monetary policy, nevertheless the BoE head's emphasis on a strong labor market, including stable growth of average wages, can serve a good service to the pound's fans. When most sell sterling, the positive from the Central Bank is able to fool those who came in late to join the downward path of the GBP/USD. Technically, reaching a target of 127.2% for the subsidiary "shark" pattern increases the risks of a pullback of the pair being analyzed in the direction of 1.37 and 1.383. The renewal of the May low will create the prerequisites for continuing the peak in the direction of the 88.6% target over the parent "shark" pattern. GBP/USD, daily chart 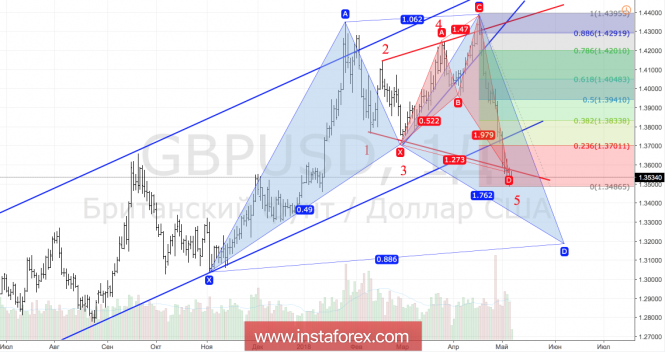 Analysis are provided byInstaForex. Analysis are provided byInstaForex.
|
|
|
|
Post by IFX Yvonne on May 10, 2018 2:46:11 GMT -5
GBP/JPY Reversed Nicely Off Resistance, Remain Bearish GBP/JPY reversed off its resistance at 149.20 (100% Fibonacci extension, 38.2% Fibonacci retracement, horizontal overlap resistance) where we expect prices to drop to its support at 147.14 (horizontal swing low support) Stochastic (89, 5, 3) is reversed off its resistance at 96% where it has a lot of corresponding downside potential. Sell 149.20. Stop loss at 150.01. Take profit at 147.14. 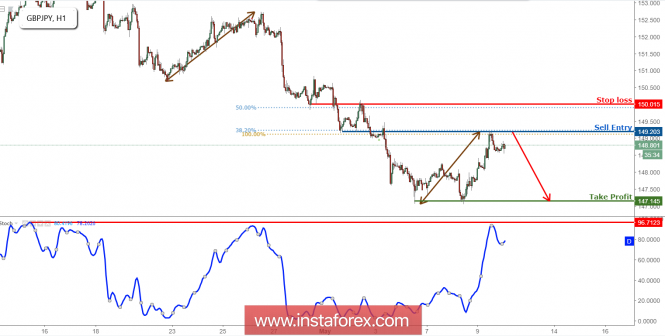 *The market analysis posted here is meant to increase your awareness, but not to give instructions to make a trade. *The market analysis posted here is meant to increase your awareness, but not to give instructions to make a trade.
|
|
|
|
Post by instaforexgertrude on May 10, 2018 22:29:25 GMT -5
Euro buyers have a chanceWeak data on producer prices in the US and the performance of representatives of the Fed did not put much pressure on the US dollar, which will continue its steady growth against risky assets. According to the report, the producer price index in the US for the month of April this year grew by only 0.1% after rising by 0.3% in March. Economists expected inflation to grow by 0.2%. Compared to the same period in 2017, producer prices rose only 2.6%, also showing a slowdown. Economists had expected growth of 2.8%. The speech of the President of the Federal Reserve Bank of Atlanta, Raphael Bostic, was rather optimistic. Bostic said that a gradual increase in rates would lead to an increase in inflation above the target level and the economy is close or has already reached full employment. He also noted that the Fed will continue to closely monitor the signs of rising price pressure, as inflation is close to achieving the target level. According to the representative of the Fed, the main risk for the US economy is associated with uncertain prospects for trade. The buyers of the euro managed to hold within the minimum of the month in yesterday's session, which indicates an upcoming upward correction. However, for this it is necessary to break above the resistance level of 1.1890, where the areas of 1.1930 and 1.1970 open. The New Zealand dollar collapsed against the US dollar after the Reserve Bank of New Zealand left the official interest rate unchanged at 1.75%, saying that monetary policy will remain stimulating for a long time. According to the RBNZ, the growth of the world economy will support the demand for New Zealand exports, and government and consumer spending will support GDP growth. Economists predict annual inflation of 2% in the fourth quarter of 2020, while the current level was previously expected in the third quarter. The official interest rate is also expected at 2% in the first quarter of 2020. 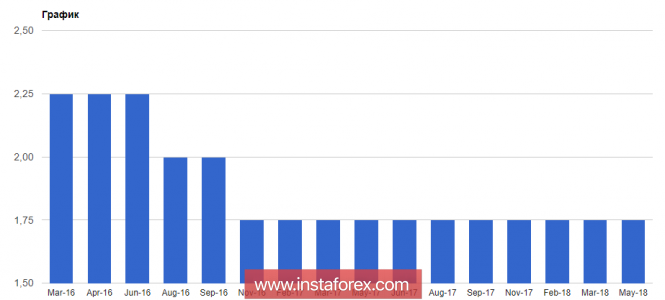 Data on the Chinese economy have passed without a trace for commodity currencies. According to the report, China's consumer price index rose by 1.8% in April compared to the same period last year. It is important to note that in March, the growth was 2.1%. As noted in the report, the main pressure on the index was created by falling prices for pork. Compared with April 2017, it decreased by 16.1%. Prices for non-food products rose by 2.1%. Economists predicted that in April, consumer prices will rise by 1.9%. *The market analysis posted here is meant to increase your awareness, but not to give instructions to make a trade. Analysis are provided byInstaForex.
|
|
|
|
Post by instaforexgertrude on May 15, 2018 0:17:32 GMT -5
Correction potential in the euro can be restrainedThe upward correction in the European currency continued on Friday amid a lack of good fundamental statistics on the US economy, as well as rather restrained statements by the representatives of the Federal Reserve, in particular James Bullard, who stated that it was necessary to "slow down" with the increase in rates. According to the University of Michigan, consumer sentiment in the US in May remained unchanged. Despite the fact that the index is preliminary, the lack of growth in consumer confidence could negatively affect the economy in the second quarter of this year. Thus, the leading index of consumer sentiment at the University of Michigan in May this year was 98.8 points, unchanged from April. Economists had expected the index to be 98.0 points. Let me remind you that in March the mood index rose to 101.4 points, and then began its decline. 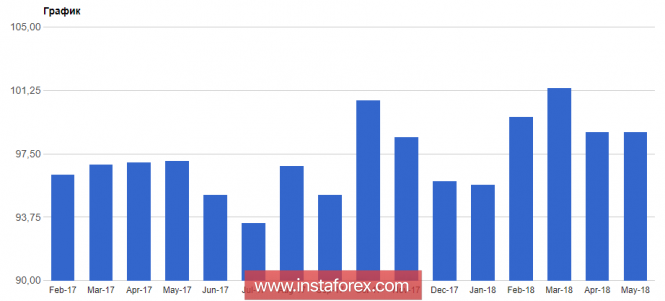 As noted above, the speech of the representative of the Fed Bullard was of a rather interesting nature. Despite the fact that the US economy is in very good condition and there are no problems with inflation growth above 2% the regulator will not, Bullard is concerned that two more rate hikes this year could lead to a coup in the yield curve of government bonds. In his view, it is wrong to assume that a reversal of the yield curve will not lead to serious changes in the market. In this connection, the official of the Federal Reserve indicated that he will express his disagreement with the further increase of interest rates this year. His colleague in the role, Loretta Mester, was more optimistic. In her opinion, the Fed may have to make their policies deterrent, as the neutral interest rate increases. However, improving economic prospects will be a strong argument in favor of further tightening of monetary policy, as this will prevent overheating of the economy. Mester is sure that the prospects for the economy are positive, and the level of full employment has been reached in the labor market. As for the technical picture of the EURUSD pair, buyers of risky assets have already formed a fairly large upward wave, which led the trading instrument to the resistance level area of 1.1980. Only its breakthrough will serve as a new impetus to the opening of long positions in the expectation of updating the highs of 1.2020 and 1.2070. If the bulls are not so persistent, and in the resistance area 1.1980 there will be a drop in demand for risky assets, another attempt to return to the market of large sellers with the removal of stop orders of buyers below the support of 1.1930 is not ruled out. *The market analysis posted here is meant to increase your awareness, but not to give instructions to make a trade. Analysis are provided byInstaForex.
|
|
|
|
Post by instaforexgertrude on May 16, 2018 0:57:34 GMT -5
Weak indicators of GDP growth in the Eurozone put pressure on the euroThe Eurozone's weak economic growth, along with the slowdown in its flagship German economy, has affected the sentiment of traders who are rushing to lock in long positions in the European currency after the recent corrective growth. According to the Federal Bureau of statistics, German economic growth slowed in the 1st quarter of 2018. As noted in the report, one of the reasons for the slowdown was a series of strikes that swept through Germany. Thus, GDP growth in annual terms was at 1.2% against 2.5% in the 4th quarter of 2017. Economists also predicted a slowdown in the German economy in the 1st quarter. According to the Bureau of statistics, France's GDP growth for 2017 was revised to 2.2%, from 2%, as previously reported. Good GDP growth was recorded in the 1st quarter in Spain, which partly offset the fall in the overall indicator for the Eurozone. According to the report of the statistical Agency Eurostat, the growth rate of economic activity slowed. Thus, the Eurozone economy in the 1st quarter of 2018 grew by only 0.4% compared to the previous quarter after an increase of 0.7% in the 4th quarter of last year. These data fully coincided with the preliminary forecast, as well as with the expectations of economists. 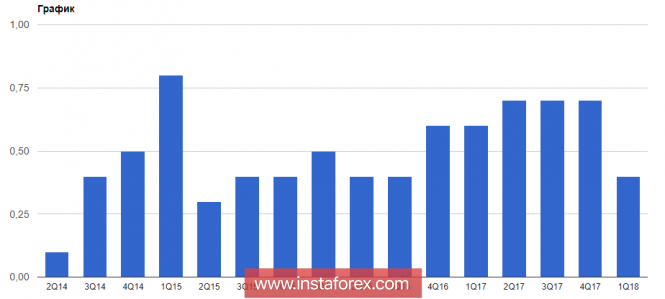 As for the technical picture of the EUR/USD pair, the bearish scenario continues to work out. The breakthrough of support at 1.1890, from which the euro continued to grow on Friday, could lead to a number of new short positions and a further decline of the euro towards the low of 1.1850 and 1.1820 The British pound did not receive much support after the publication of the report on the labor market, which indicated that from January to March this year, unemployment in the UK remained at its minimum level. According to the National Bureau of Statistics, unemployment remained at 4.2 percent, while the number of unemployed in the UK decreased by 46,000 during the reporting period. Despite this, the pound continues to decline, moving towards the lower border of the side channel, which was formed after the decision of the Bank of England on interest rates last week in the level of 1.3460. Data from the National Bureau of Statistics also came out in the first half of the day, which indicated that industrial production in China in April of this year increased by 7.0% compared to the same period last year after an increase of 6.0% in March. Economists had expected production to grow by 6.4 percent. aRetail sales in China rose only 9.4% in April, following a 10.1% increase in March compared to the same period last year. The unemployment rate fell to 4.9% in April. Analysis are provided byInstaForex.
|
|
|
|
Post by instaforexgertrude on May 17, 2018 0:48:31 GMT -5
Technical analysis of GBP/JPY for May 17, 2018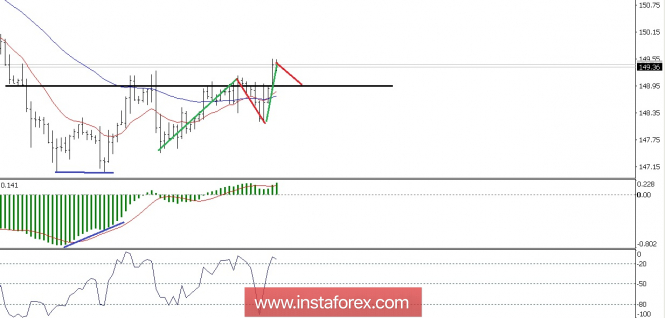 The GBP/JPY at 4-Hour Charts seem already making higher highs and higher lows after the MACD Divergence with the price but this pair now getting struggles with the Support Become Resistance level at 149.11 events now this pair already breakout above those level now the GBP/JPY must test the 149.11 level first as their new Support before they can go up, this condition already confirmed by the William %R(14) already at Overbought side. So this pair in a short time manner will be going down to test the 149.11 level. Analysis are provided byInstaForex.
|
|
|
|
Post by instaforexgertrude on May 18, 2018 0:15:40 GMT -5
Daily analysis of EUR/JPY for May 18, 2018EUR/JPY There are still mixed signals in the market. The EMA 11 is slightly below the EMA 56, and the RSI period 14 is slightly above the level 50. It may be prudent to stay away from this market until there would be a directional movement in it. 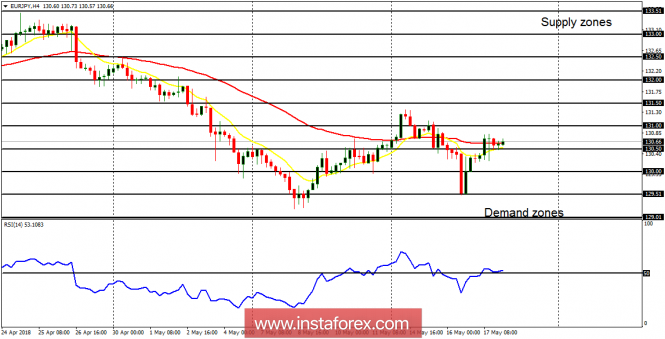 At least, in the short-term, nothing has really changed in this market. The price plummeted on Monday and Tuesday and Wednesday, to test the demand zone at 129.50. After that, a rally effort was made, which made price rose by 110 pips, thereby frustrating the bears. Investors may want to wait until there is a directional movement in the market. Analysis are provided byInstaForex.
|
|
|
|
Post by instaforexgertrude on May 21, 2018 1:56:56 GMT -5
Technical analysis of Gold for May 21, 2018Gold price is breaking down below the recent $1,285-$1,295 consolidation. Gold price could see $1,270-75, but the bearish divergence signs continue to warn us that the next big move will be to the upside. I'm a buyer of Gold at the current or lower levels. 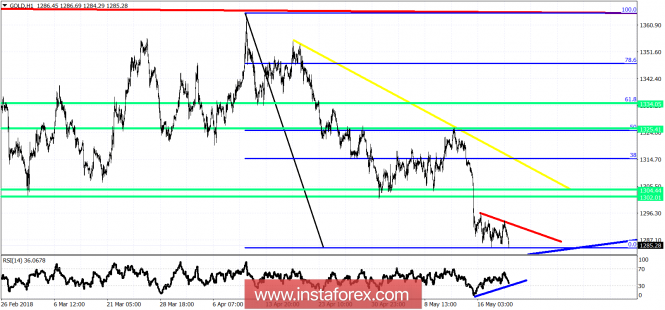 Blue lines - bullish divergence warning Green lines - target levels Yellow line - medium-term resistance Red line - short-term resistance Short-term resistance is at $1,292. I expect Gold price to soon break above it and move towards our first targets of $1,302-$1,304. Next important resistance is at $1,310-13 where I can see the next big trend test. With a break above this level, the price will move towards the 50% and 61.8% Fibonacci retracement. A weekly close above the 61.8% Fibonacci retracement will open the way for a bigger move towards $1,425. Gold is at its final stages of the move from the $1,365 level. Analysis are provided byInstaForex.
|
|
|
|
Post by instaforexgertrude on May 22, 2018 0:54:18 GMT -5
Pound returns to politicsQuotes of the GBP/USD slumped to a five-month low as it came under fire on three sides. The lack of a unified position within the conservative party on the basic principles of Brexit has revived political risks, negative statistics on the U.K. continues to reduce the likelihood of tightening the monetary policy of the Bank of England in 2018, and, finally, the unrestrained growth of the yield of Treasury bonds pushes up the US dollar. Such an unfavorable background makes the position of the sterling extremely vulnerable, but Forex is good because the situation can be turned upside down in a matter of moments. Unexpected comments by Theresa May that Britain will still come out of the Customs Union, became a verdict for the pound. A week ago, the market was walking directly opposite rumors, which at that time had some support for the "bulls" on the GBP/USD. Even for a little while. The Prime Minister said that there is no reason for a second referendum on Scotland's independence, although in the North of the United Kingdom there are quite different sentiments. In general, the divide is felt in all politics, not only in the conservative party, which plays against sterling. The futures market is on the verge of abandoning the idea of raising the REPO rate by 25 bp in 2018. Previously, there was confidence in two acts of monetary tightening, and after the May meeting of the Bank of England, the likelihood of a hike in August were regarded as a fifty-fifty. However, the busy economic calendar for the week to May 25 a priori nominates the pound for the title of the most interesting currency of the five-day period. Bloomberg analysts expect to see April inflation and GDP for the first quarter at the same levels of +2.5% yoy and +0.1% q/q, and also forecast a slowdown in retail sales to a six-month low. At the same time, the BoE in its most recent accompanying documents noted that the second assessment of January-March, in fact, is likely to be the best. If inflation also begins to move away from the target in the direction of 3%, the idea of two acts of monetary tightening in 2018 will rise from the ashes. And if so, then the "bulls" on the GBP/USD after long ordeals will still feel the ground beneath their feet. Dynamics of the British inflation 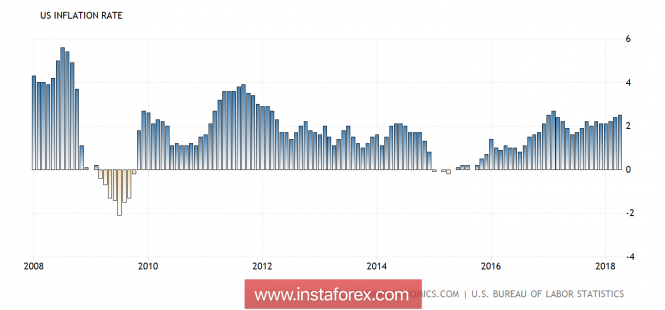 The reason for their optimism can be slowed down and finally, the US dollar. Despite the fact that the news of a truce in the trade war between Beijing and Washington in the form of a temporary cancellation of tariffs for $150 billion imports has benefited the yield of Treasury bonds, however, Bloomberg's median forecast of 3.19% at the end of the year is already close, and the stabilization of the indicator will somewhat curb the enthusiasm of bulls in the USD index. In addition, after a continuous 4-week rally, some of them will probably want to lock in the profit. Technically, a clear implementation of the "Broadening Wedge" pattern brought the pair's quotes beyond the upward trading channel, and the "bears" - to the operational space, and brought them closer to the target by 88.6% in the "Double Top" pattern at arm's length. It corresponds to the level of 1.32. GBP/USD daily chart 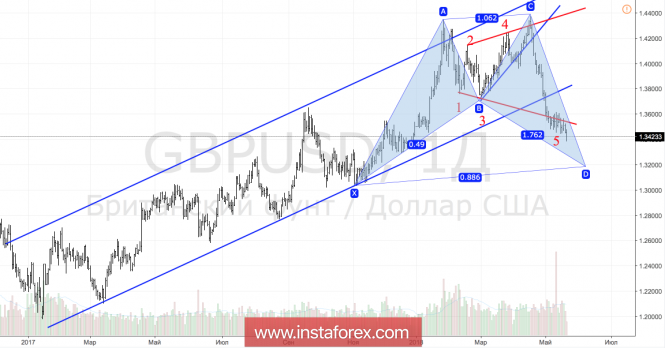 *The market analysis posted here is meant to increase your awareness, but not to give instructions to make a trade. Analysis are provided byInstaForex.
|
|
|
|
Post by instaforexgertrude on May 23, 2018 1:06:09 GMT -5
Daily analysis of USDX for May 23, 2018The index managed to make a retracement from the Monday's highs, but the 200 SMA remains as a dynamic support in the short-term, where also it has formed a fractal. We should remind that a breakout above 94.10 can open the doors for a testing of the 94.88 level. However, a breakout below the 200 SMA on H1 chart should strengthen the bearish bias. 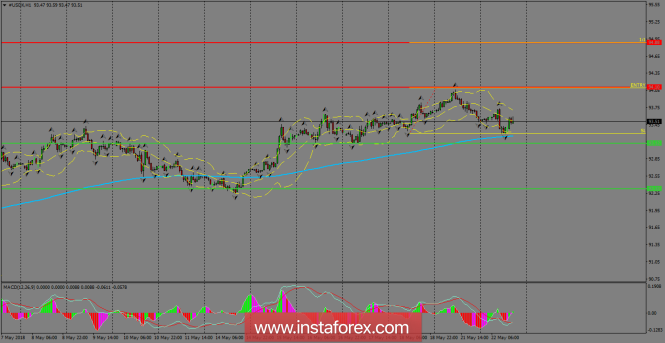 H1 chart's resistance levels: 94.10 / 94.88 H1 chart's support levels: 93.12 / 92.33 Trading recommendations for today: Based on the H1 chart, place buy (long) orders only if the USD Index breaks with a bearish candlestick; the support level is at 94.10, take profit is at 94.88 and stop loss is at 93.30. *The market analysis posted here is meant to increase your awareness, but not to give instructions to make a trade. Analysis are provided byInstaForex.
|
|


