|
|
Post by instaforexgertrude on Oct 18, 2022 1:35:40 GMT -5
Forex Analysis & Reviews: Forecast for EUR/USD on October 18, 2022The main drivers of yesterday's growth in almost all market assets were the British pound and the US stock market. The new Minister of Finance, Jeremy Hunt, canceled the so-called "mini-budget" of his predecessor Kwarteng, on which the currency and debt markets of Great Britain went up. The pound rose by 1.05%, S&P 500 by 2.65%, also growing under the impression of good corporate reports, and the euro by 1.08% (117 points). 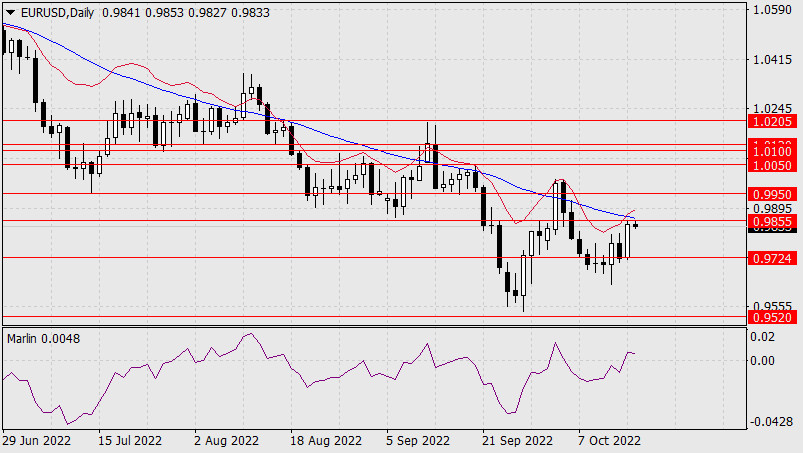 In its growth, the price almost reached the magnetic point of intersection of two lines - the target level of 0.9855 and the MACD line of the daily scale. Now the price has two actions to choose from: consolidate above this level and continue to rise to 0.9950, and turn down to the starting point of yesterday - to the level of 0.9724. The Marlin Oscillator is in the positive area, it tends to continue growing. The difficulty in choosing a direction is also that there are now two opposing investment ideas on the market: to continue buying risk on a positive background of corporate reports and to be careful in this, slowly getting rid of the euro, as amid continuing negative statistics on the euro area, the European Central Bank may raise the rate not by 0.75% but by 0.50% at a meeting on October 27, which, of course, will send the euro unambiguously down. US industrial production data for September is released today. Forecast 0.1% vs. -0.2% in August. And if the data helps the euro to overcome the current resistance of 0.9855, then this will become an indicator of the mood of investors in the coming days (growth in risk appetite). The situation is generally on the rise on a four-hour timescale. But in order to stay in the growing trend, the price must consolidate above the resistance. Otherwise, a quick return to 0.9724 may follow. This can happen in the event of sharply negative news. 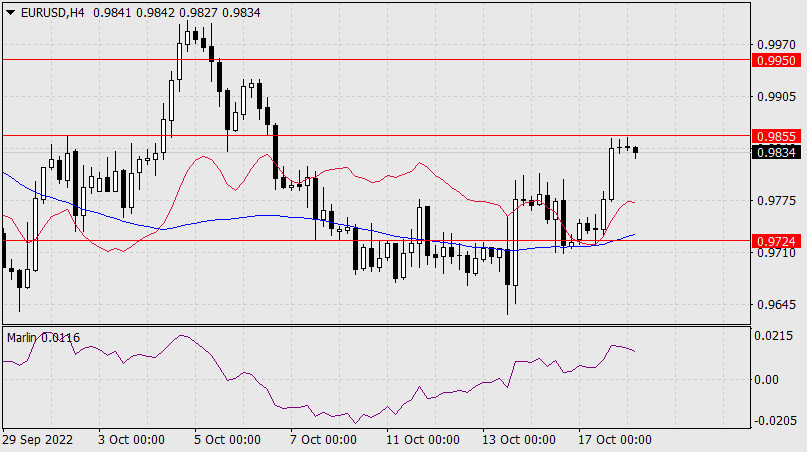 *The market analysis posted here is meant to increase your awareness, but not to give instructions to make a trade. Analysis are provided by InstaForex.Read More
|
|
|
|
Post by instaforexgertrude on Oct 20, 2022 3:44:35 GMT -5
Forex Analysis & Reviews: Forecast for USD/JPY on October 20, 2022The yen hit an important target at 150.00 (this morning's actual high of 149.96). In addition to being a round number, the target is defined by an embedded monthly timeframe price channel line. Above it are levels with increased frequency, approximately every 80 points. 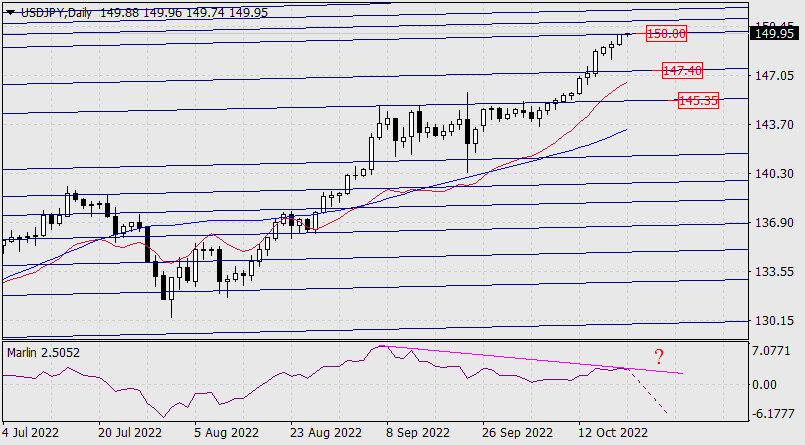 There were rumors again on the market that the Bank of Japan is preparing another intervention. The technical component also indicates to us a high probability of a price reversal during the formation of a divergence with the Marlin Oscillator. We believe that this is the main scenario for further developments. The nearest target in this case will be the price channel line in the area of 147.40. 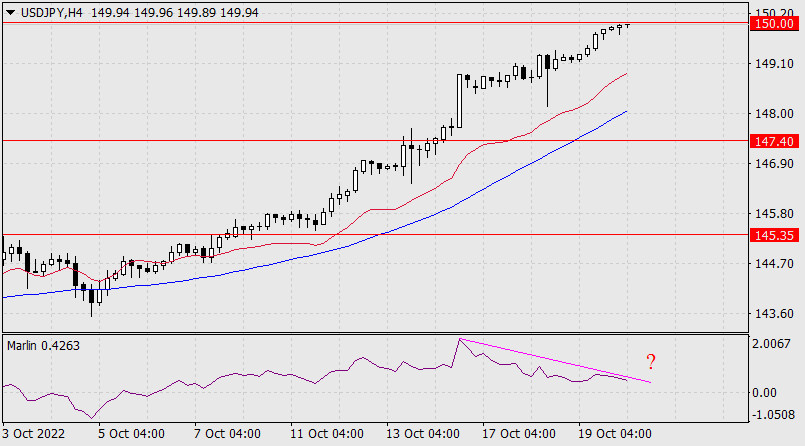 A divergence is also preparing to form on the four-hour chart. We will find out later this evening whether the reversal will take place or not. *The market analysis posted here is meant to increase your awareness, but not to give instructions to make a trade. Analysis are provided by InstaForex.Read More
|
|
|
|
Post by instaforexgertrude on Oct 20, 2022 23:17:05 GMT -5
Forecast for EUR/USD on October 21, 2022The euro bulls did not want to give up easily yesterday - the trading range was 92 points and the day closed with a white candle of 15 points. On the technical side, the price took advantage of the confusion of the Marlin Oscillator at the zero neutral line. 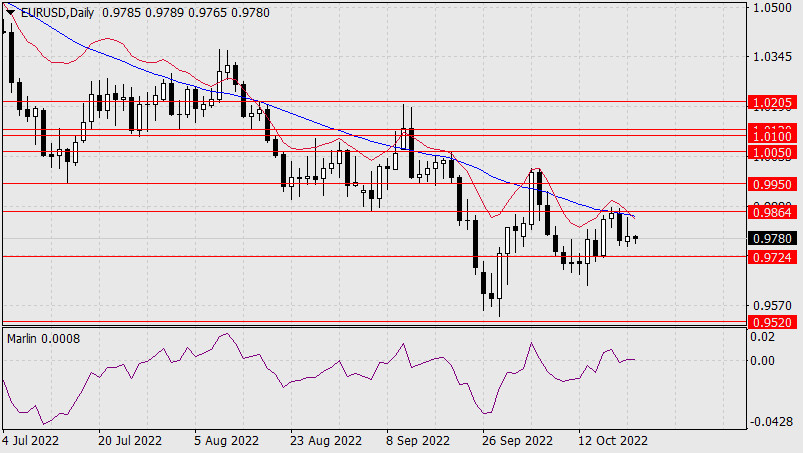 But already in the Pacific session, yesterday's growth was blocked, the price again rushed to the nearest support of 0.9724, the Marlin Oscillator is pushing through the support of this zero line. A decline below 0.9724 opens the next target at 0.9520. 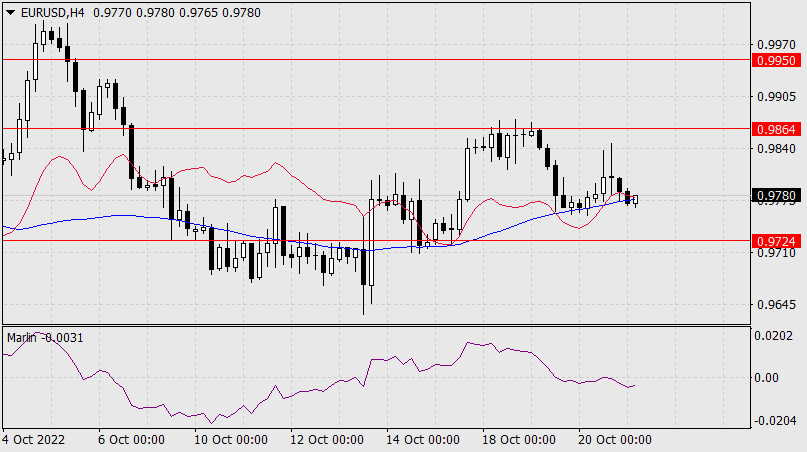 On the four-hour chart, the price makes a second attack on the support of the MACD line. The price also moved under the balance indicator line, which shows us the shift in the players' mood to sell. The Marlin Oscillator is moving deeper into the downward trend. *The market analysis posted here is meant to increase your awareness, but not to give instructions to make a trade. Analysis are provided by InstaForex.Read More
|
|
|
|
Post by instaforexgertrude on Oct 24, 2022 0:19:37 GMT -5
Forecast for EUR/USD on October 24, 2022On Friday, the head of the San Francisco Federal Reserve, Mary Daly, said that the high pace of rate hikes is slowing down the economy, this pace needs to be slowed down. As a result, yields on government bonds fell, stock indices rose, and the euro closed the day up 75 points. The quote of the single currency again reached the resistance of 0.9864 and the MACD indicator line. The European Central Bank raises rates on the 27th, but we still doubt the market's willingness to switch so quickly from the Fed's leading role in pricing the euro to the ECB's leading position. Eurozone business activity indicators for October will be released today, and a recession is predicted for them. 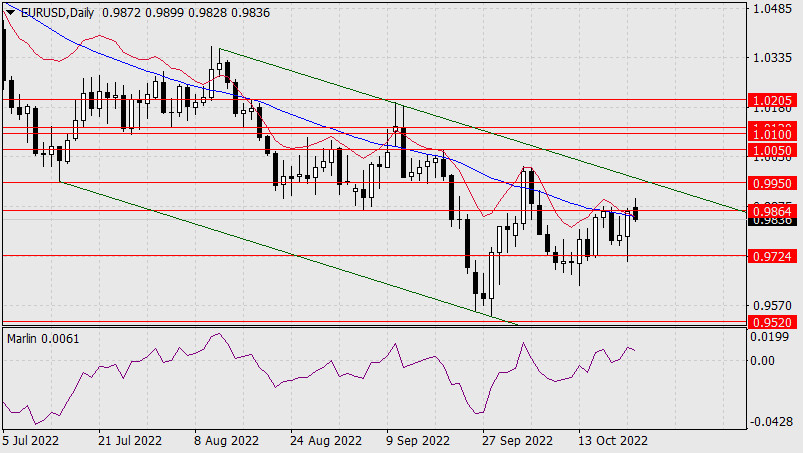 On the technical side, in order to consolidate the euro in the green, the price needs to go above the descending price channel, marked in green on the daily chart, that is, above the level of 0.9950. Price development above 0.9864 (September 6 low) before breaking 0.9950 in this situation is considered as a false exit above the MACD indicator line. Consolidation below this line may bring the price back to support 0.9724. The Marlin Oscillator is already turning down and does not share the optimism of the price. 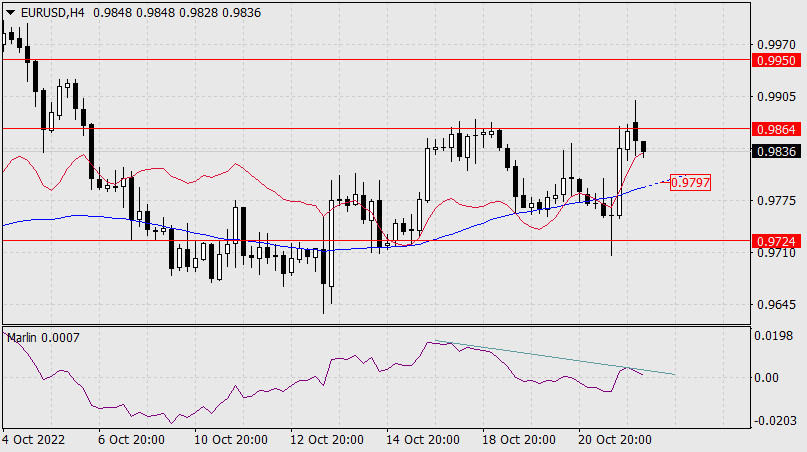 The price is already forming a divergence with Marlin on the H4 chart. As long as it's weak. A decline below the MACD line (0.9797) will set the bearish mood for the euro. *The market analysis posted here is meant to increase your awareness, but not to give instructions to make a trade. Analysis are provided by InstaForex.Read More
|
|
|
|
Post by instaforexgertrude on Oct 25, 2022 1:28:19 GMT -5
Forex Analysis & Reviews: Elliott wave analysis of Litecoin for October 25, 2022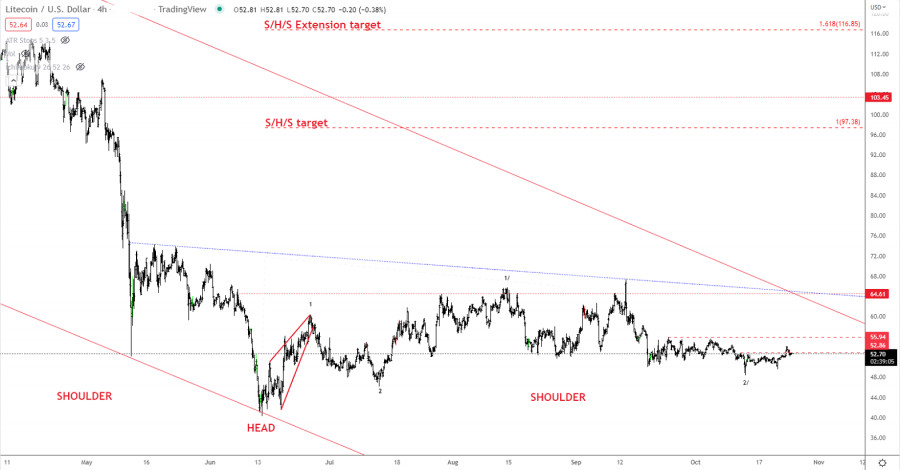 Our preferred scenario for Litecoin shows that wave 2/ completed at 48.41 but we need a break above resistance at 55.94 to confirm the low and a rally to the neckline resistance near 65.10. Only a break above here will confirm a long-term corrective low being in place for the next strong rally higher to 97.38 and likely even closer to 116.85. In the longer term, a break above the neckline resistance will indicate a new impulsive rally towards the former peaks in the 375 - 400 area. *The market analysis posted here is meant to increase your awareness, but not to give instructions to make a trade. Analysis are provided by InstaForex.Read More
|
|
|
|
Post by instaforexgertrude on Oct 26, 2022 3:01:31 GMT -5
Forex Analysis & Reviews: Elliott wave analysis of Litecoin for October 26, 2022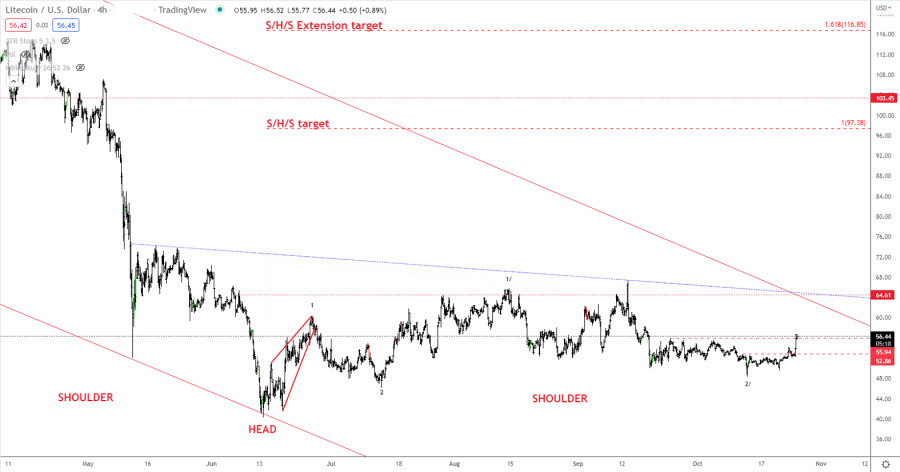 Litecoin has now broken above resistance at 56.43 which will be calling for more upside towards the S/H/S bottoms neckline near 65.00. A break above here will activate the bottom formation for a rally towards the S/H/S-target at 97.38 and possibly even the extension target at 116.85. However, in the longer term, we expect a much stronger rally and Litecoin to continue higher towards its all-time high near 400. Ultimately, the all-time high peak at 413.60 should be broken too, but it could be far out in the future. So, let's work with the data we have and take it in baby steps as always and look for a test of the neckline resistance at 65.00 as the next upside target. *The market analysis posted here is meant to increase your awareness, but not to give instructions to make a trade. Analysis are provided by InstaForex.Read More
|
|
|
|
Post by instaforexgertrude on Oct 26, 2022 3:07:03 GMT -5
US stock market closes higher, Dow Jones gains 1.07%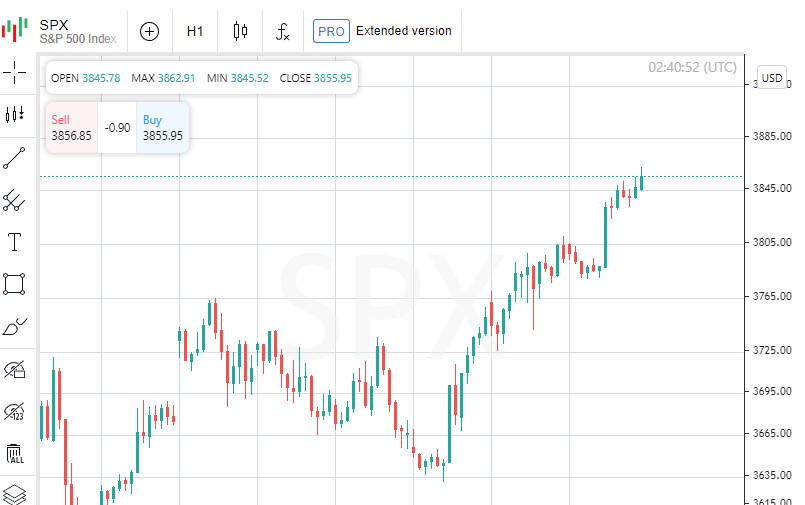 At the close of the New York Stock Exchange, the Dow Jones rose 1.07% to hit a monthly high, the S&P 500 rose 1.63% and the NASDAQ Composite rose 2.25%. The top performer among the components of the Dow Jones index today was Nike Inc, which gained 3.71 points (4.22%) to close at 91.72. Quotes of American Express Company rose by 5.39 points (3.81%), closing the session at 147.02. Boeing Co rose 4.60 points or 3.24% to close at 146.65. The biggest losers were The Travelers Companies Inc, which shed 3.70 points or 2.06% to end the session at 176.09. Amgen Inc was up 1.33 points (0.51%) to close at 259.99, while UnitedHealth Group Incorporated was down 1.38 points (0.25%) to close at 540. 22. Leading gainers among the S&P 500 index components in today's trading were Centene Corp, which rose 10.47% to 83.75, IQVIA Holdings Inc, which gained 10.17% to close at 197.83, and shares of Charles River Laboratories, which rose 9.10% to end the session at 219.12. The losers were Brown & Brown Inc, which shed 12.65% to close at 55.10. Shares of Cadence Design Systems Inc shed 5.55% to end the session at 151.32. Quotes W. R. Berkley Corp fell in price by 4.64% to 69.20. Leading gainers among the components of the NASDAQ Composite in today's trading were Taysha Gene Therapies Inc, which rose 97.35% to hit 2.98, Fangdd Network Group Ltd, which gained 89.64% to close at 1.26. , as well as shares of Revelation Biosciences Inc, which rose 64.60% to close the session at 0.41. The biggest losers were Hoth Therapeutics Inc, which shed 26.37% to close at 0.24. Shares of Mana Capital Acquisition Corp lost 23.24% to end the session at 5.99. Quotes TuanChe ADR fell in price by 18.45% to 6.32. On the New York Stock Exchange, the number of securities that rose in price (2619) exceeded the number of those that closed in the red (487), while quotations of 112 shares remained practically unchanged. On the NASDAQ stock exchange, 2989 companies rose in price, 753 fell, and 241 remained at the level of the previous close. The CBOE Volatility Index, which is based on S&P 500 options trading, fell 4.66% to 28.46, hitting a new monthly low. Gold futures for December delivery added 0.21%, or 3.55, to $1.00 a troy ounce. In other commodities, WTI crude futures for December delivery rose 0.39%, or 0.33, to $84.91 a barrel. Brent futures for January delivery fell 0.05%, or 0.05, to $91.16 a barrel. Meanwhile, in the Forex market, EUR/USD rose 0.94% to hit 1.00, while USD/JPY fell 0.71% to hit 147.90. Futures on the USD index fell 1.03% to 110.75. News are provided by
InstaForex.Read More
|
|
|
|
Post by instaforexgertrude on Oct 27, 2022 1:22:30 GMT -5
Forex Analysis & Reviews: Gold still attractive for buyers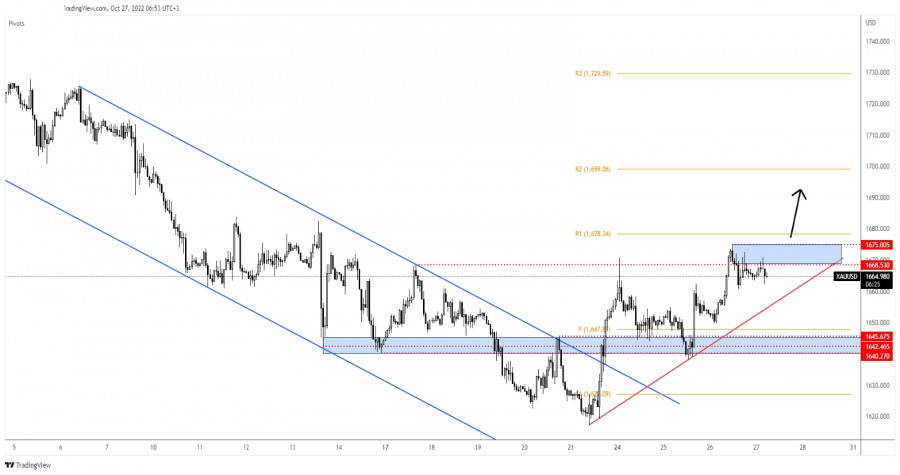 The price of gold dropped in the short term after reaching the 1,675 level. Now, it is traded at 1,664 at the time of writing. XAU/USD slipped lower as the DXY tried to rebound. Still, Gold could try to develop a new bullish momentum as the Dollar Index is under downside pressure. Today, the fundamentals will drive the price, so you have to be careful. The ECB is expected to increase the Main Refinancing Rate from 1.25% to 2.00%. The Monetary Policy Statement and the ECB Press Conference could really shake the markets. Also, the US Advance GDP is expected to register a 2.3% growth, Advance GDP Price Index may report a 5.3% growth, Unemployment Claims could be reported at 219K, Durable Goods Orders could register a 0.6% growth, while Core Durable Goods Orders may report a 0.2% growth. As you can see on the H1 chart, XAU/USD found resistance at 1,668. The bias remains bullish as long as it stays above the uptrend line. Technically, after its strong growth, a temporary drop was natural. Staying near the 1,668 resistance may signal an imminent breakout. Temporary consolidation could bring more bullish energy and attract more buyers. XAU/USD Forecast! Staying above the minor uptrend line and making a valid breakout above 1,675 could confirm further growth. A new higher high is seen as a buying opportunity. The 1,700 psychological level and the R2 (1,699) represent upside targets. *The market analysis posted here is meant to increase your awareness, but not to give instructions to make a trade. Analysis are provided by InstaForex.Read More
|
|
|
|
Post by instaforexgertrude on Oct 27, 2022 1:41:03 GMT -5
Forex Analysis & Reviews: Forecast for EUR/USD on October 27, 2022The euro is not letting up and yesterday it grew by another 113 points to the target range of 1.0100/20. And once again, the market is asking the question - will there be a reversal today due to the "soft" statement of the European Central Bank after the rate hike by 0.75% and the expected growth of US GDP for the 3rd quarter by 2.4%, which will mean the end of the recession? 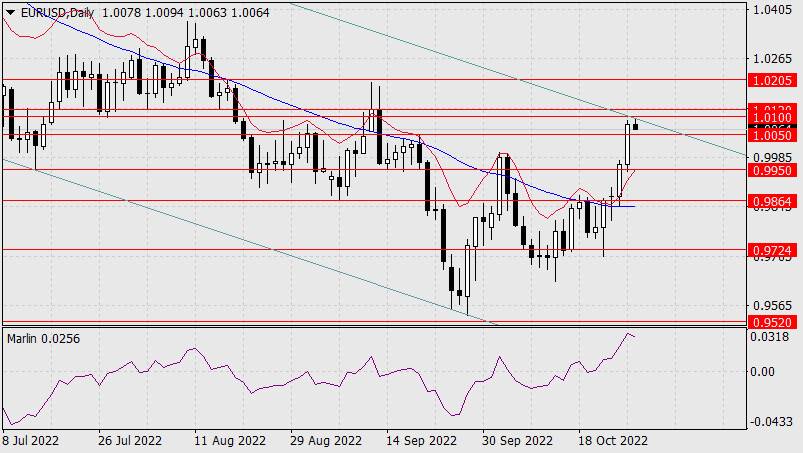 From a purely technical point of view, the probability of a reversal is 60%, since the price is at the upper border of the downward price channel of the weekly timeframe. The Marlin Oscillator is also not averse to turning down. Of course, the price's exit above the target range of 1.0100/20 will allow the price to reach the target of 1.0205 - to renew the high on September 12th. Additional information, unfortunately, is not visible on the four-hour chart. The price is quite able to reach the 1.0100/20 range, but the indicators do not suggest what will happen next. Without a doubt, today's events (the ECB meeting and the release of the US GDP) are such important events that they can move the single currency's quote in any direction. We are waiting for the development of events. In general, the fundamental pressure on the euro remains and the ongoing growth is still a correction. 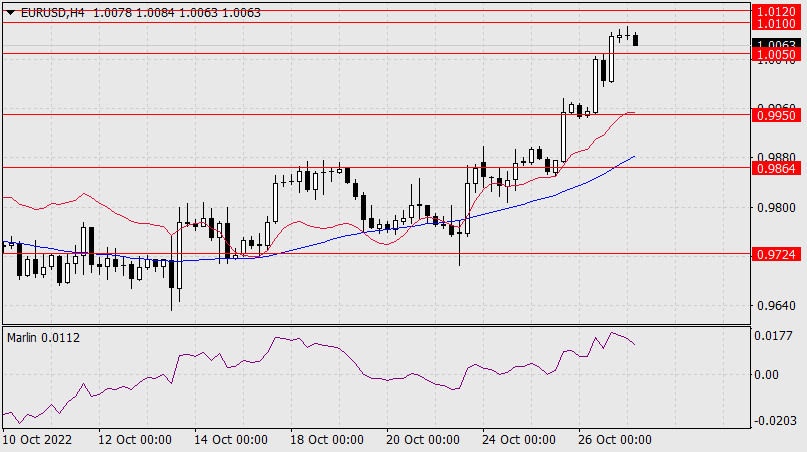 Analysis are provided by InstaForex.Read More Analysis are provided by InstaForex.Read More
|
|
|
|
Post by instaforexgertrude on Oct 28, 2022 4:22:26 GMT -5
Forex Analysis & Reviews: Technical Analysis of GBP/USD for October 28, 2022Technical Market Outlook: The GBP/USD pair has hit the projected target level at 1.1625 (61% Fibonacci extension of the wave A) and is approaching the intraday technical support seen at 1.1496. The local high was even made at the level of 1.1644 before the Pin Bar candlestick pattern forced bulls to pull-back towards the technical support. The market is ready to extend the breakout towards the projected target level located at 1.1717 (supply zone) or higher. The intraday technical support is seen at 1.1496 and 1.1544. The momentum is strong and positive, which supports the short-term bullish outlook for GBP. Only a sudden and strong breakout below the 30 periods moving average would change the imminent outlook to bearish. 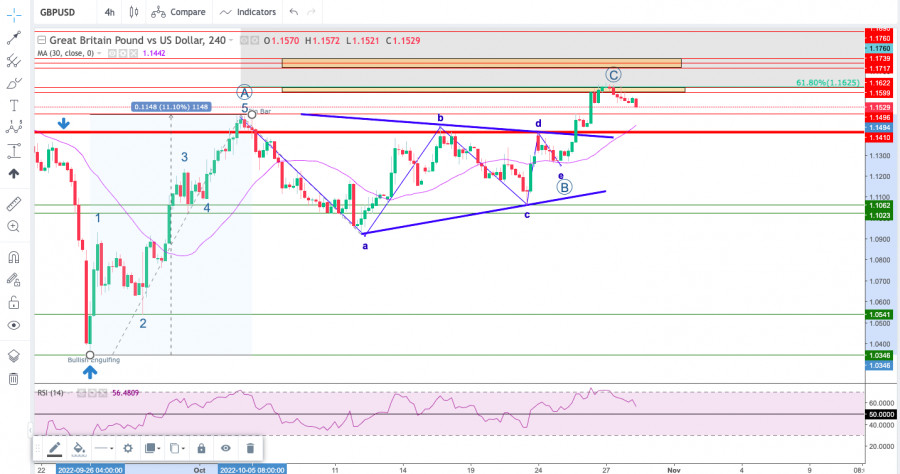 Weekly Pivot Points: WR3 - 1.15209 WR2 - 1.14338 WR1 - 1.13938 Weekly Pivot - 1.13467 WS1 - 1.13067 WS2 - 1.12596 WS3 - 1.11725 Trading Outlook: The bears are still in charge of Cable and the next long-term target for them is the parity level. The level of 1.0351 has not been tested since 1985, so the down trend is strong, however, the market is extremely oversold on longer time frames already. In order to terminate the down trend, bulls need to break above the level of 1.2275 (swing high from August 10th). *The market analysis posted here is meant to increase your awareness, but not to give instructions to make a trade. Analysis are provided by InstaForex.Read More
|
|
|
|
Post by instaforexgertrude on Oct 30, 2022 23:18:10 GMT -5
Forex Analysis & Reviews: Forecast for EUR/USD on October 31, 2022On Monday, the euro faces the 0.9959 support level.The target level of 0.9864 is at the bottom, and at the top is the resistance of 1.0051 (high on September 20) and the upper limit of the price channel. In general, the dollar feels strong on the market, but there is also an increased interest in risk in the market, which can pull the euro up (on Friday, the S&P 500 added 2.46%). 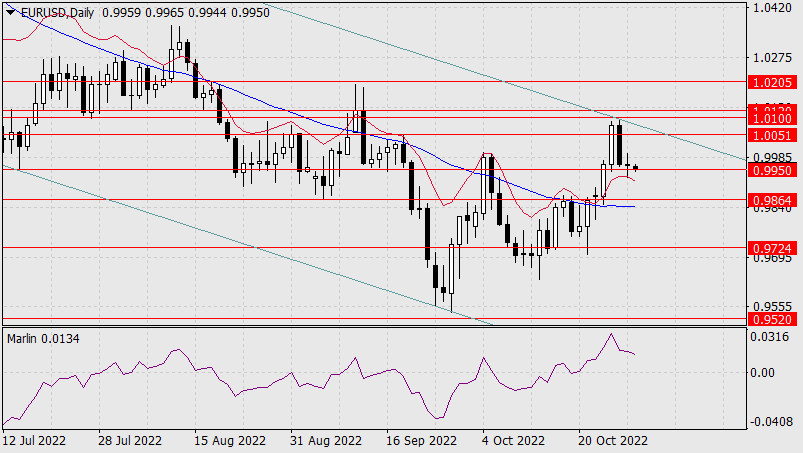 On the other hand, Friday could also be the last day of such appetites, as the Federal Reserve is expected to raise the rate by 0.75% to 4.00% on Wednesday. Also, weak data on the eurozone may come out today. Retail sales in Germany for September are expected to be -0.3% m/m (decreasing at an annual pace from -4.3% to -4.9%), while euro area GDP for the 3rd quarter may be as low as 0.1%, which will reduce annual growth from 4.1% to 2.1%. The euro is more likely to decline from these positions. After consolidating under 0.9950, we are waiting for the price at 0.9864. 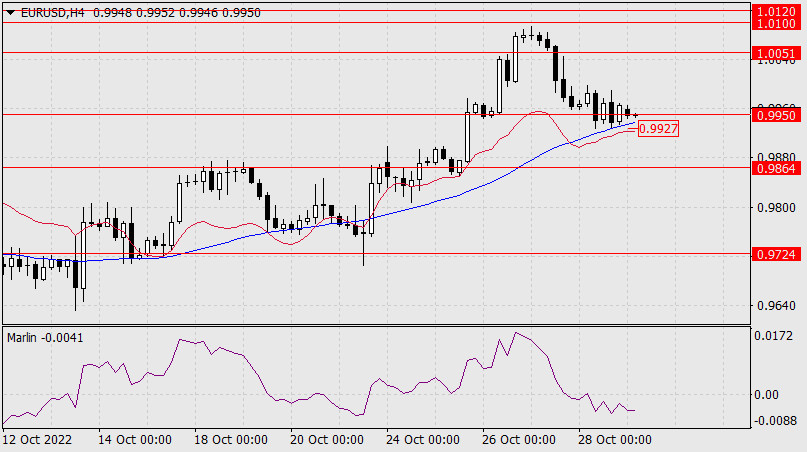 On the four-hour chart, the price is consolidating at the support level and on the MACD indicator line. Overcoming supports will be a signal to decline. More precisely, the signal level is Friday's low at 0.9927. The Marlin Oscillator is falling in negative territory. Analysis are provided by InstaForex.Read More
|
|
|
|
Post by instaforexgertrude on Nov 1, 2022 0:29:58 GMT -5
Forex Analysis & Reviews: Forecast for EUR/USD on November 1, 2022The euro undertook a downward breakout on Monday. Having made a path of 80 points, the euro has almost reached the target support of 0.9864. Apparently, the price lingered before the support to build up strength before it was overcome, as the support is strengthened by the MACD line (0.9840). Overcoming the formed range (0.9840/64) opens a further path to the target support at 0.9715 – to the April 2000 high. 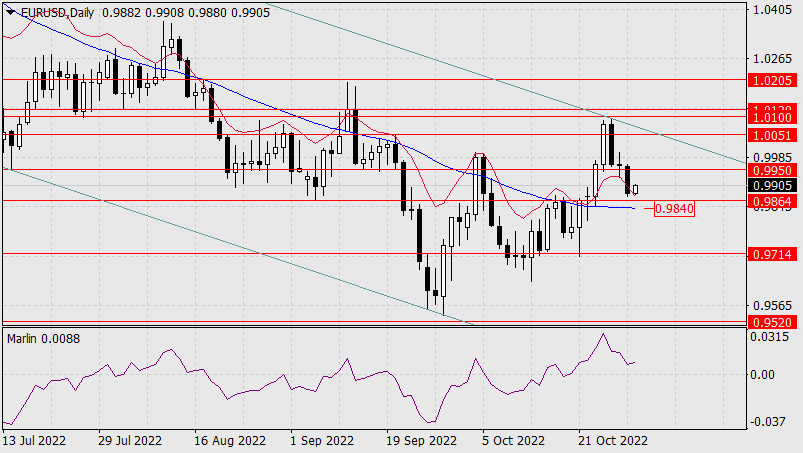 The Marlin Oscillator is approaching the zero line on the daily. It is likely that the price will overcome the support range and the zero line oscillator at the same time. Such synchronization will lead to a powerful downward movement. In terms of timing, such a breakthrough may take place tomorrow - on the day of the Federal Reserve meeting. On the four-hour chart, the price consolidated under the indicator lines of balance (red) and MACD. The Marlin Oscillator is developing in the downward trend zone. Today, consolidation is likely before the breakout of the planned supports, or even the first attempt at such a breakout. 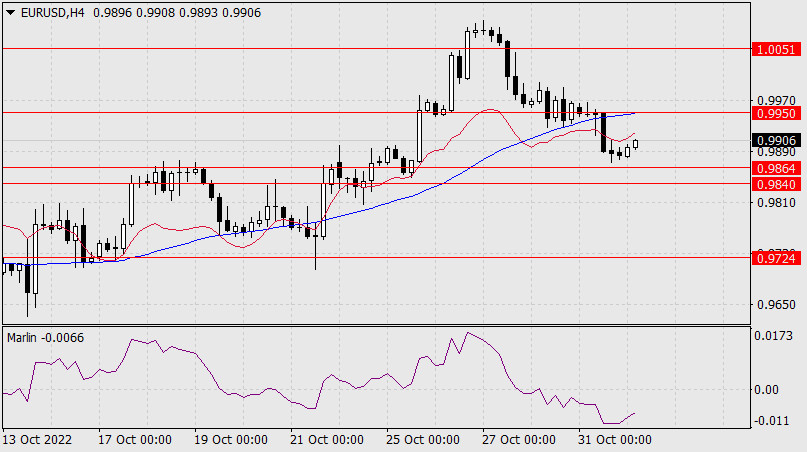 *The market analysis posted here is meant to increase your awareness, but not to give instructions to make a trade. Analysis are provided by InstaForex.Read More
|
|
|
|
Post by instaforexgertrude on Nov 2, 2022 1:09:24 GMT -5
Forex Analysis & Reviews: Elliott wave analysis of Litecoin for November 2, 2022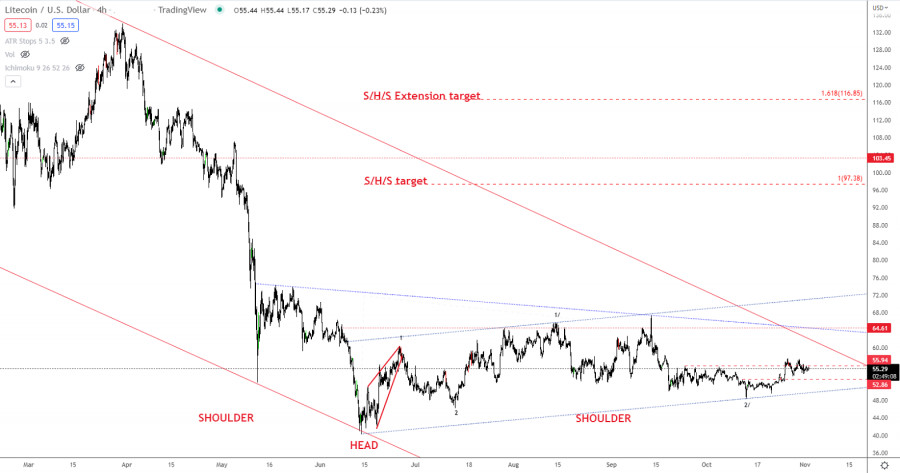 Litecoin is still fighting to break clear of resistance at 55.94. A break above minor resistance at 57.40 will confirm continuation higher towards the neckline resistance near 64.60. Only a break above here activates the formation for a rally towards the S/H/S target at 97.38 and possibly even closer to the extension target at 116.85. Only a break below support at 54.18 will delay the expected rally higher and call for a dip to 50.00 before turning higher again. *The market analysis posted here is meant to increase your awareness, but not to give instructions to make a trade. Analysis are provided by InstaForex.Read More
|
|
|
|
Post by instaforexgertrude on Nov 3, 2022 1:24:28 GMT -5
Forex Analysis & Reviews: Trading Signal for GBP/USD on November 3-4, 2022: buy above 1.1378 (200 EMA - bottom bearish channel)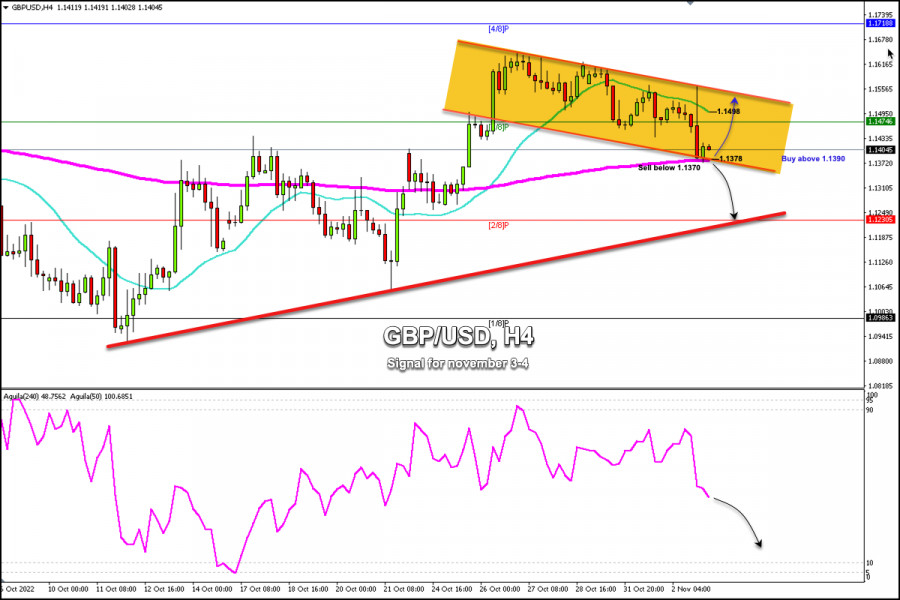 In the next few hours, we could expect a technical bounce above the 200 EMA around 1.1378. So, the price could reach 3/8 Murray at 1.1474 and even 1.1550 (top bearish channel). Conversely, in case of a sharp break below the 200 EMA and a daily close on the 4-hour chart below 1.1370, the currency pair could continue the bearish bias and the price could reach 2/8 Murray around 1.1230. The eagle indicator is giving a negative signal and any bounce towards the psychological level of 1.15 will be considered a signal to continue selling. Our trading plan for the next few hours is to buy above the 200 EMA and above the bottom of the downtrend channel around 1.1378 with targets at 1.1474 and 1.1530. On the other hand, the signal to sell will be activated if there is a strong break below 1.1370 (200 EMA) with targets at 1.1230. As long as the GBP/USD pair trades within the downtrend channel formed since Oct 26, any technical bounce back towards the 21 SMA located at 1.14 98 will be seen as an opportunity to sell. *The market analysis posted here is meant to increase your awareness, but not to give instructions to make a trade. Analysis are provided by InstaForex.Read More
|
|
|
|
Post by instaforexgertrude on Nov 4, 2022 0:12:51 GMT -5
Forex Analysis & Reviews: Forecast for GBP/USD on November 4, 2022The Bank of England raised the rate to the expected 0.75% and warned of two points: in the future, the pace of the rate hike will slow down, from the 3rd quarter the UK economy will enter a recession and it will last until mid-2024 with an increase in unemployment until the end of the 25th year to 6.4%. The pound fell by 230 points. Data on British GDP for the 3rd quarter will be released on November 11, the forecast of economists is -0.2%, obviously, the forecast coincides with the calculations of the central bank. 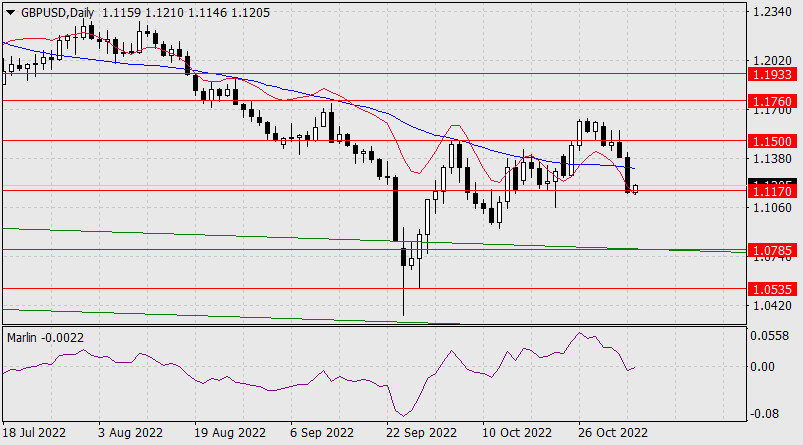 The decline continued to the target level of 1.1170 on the daily chart. The signal line of the Marlin Oscillator went below the zero line into the area of the downtrend. After the price settles under 1.1170, we are waiting for the pound to fall further to 1.0785 - to the line of the price channel of the higher timeframe. On the four-hour chart, the price, together with the Marlin Oscillator, is turning into a slight correction. Perhaps the correction will last until the first noticeable resistance at 1.1260 - the former local support for October. After the end of the correction, we are waiting for a further fall towards the specified target. 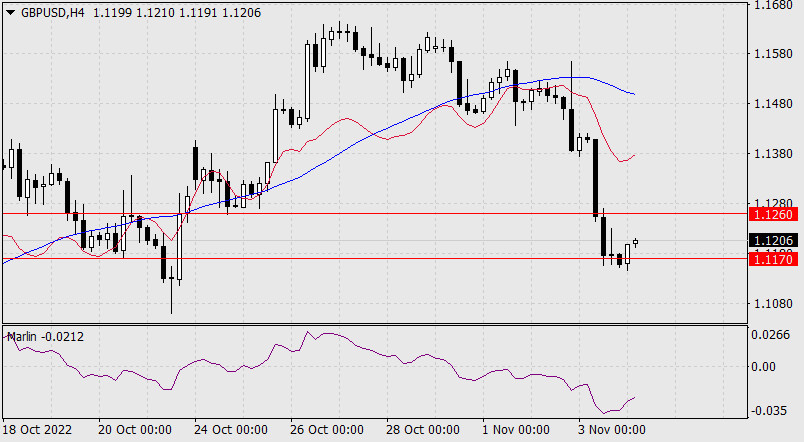 *The market analysis posted here is meant to increase your awareness, but not to give instructions to make a trade. Analysis are provided by InstaForex.Read More
|
|


