|
|
Post by instaforexgertrude on Jun 27, 2023 23:35:01 GMT -5
Forecast for EUR/USD on June 28, 2023EUR/USD: On Tuesday, European Central Bank President Christine Lagarde, at a conference in Portugal, stated with full confidence that the peak rates have been reached, which briefly stimulated the euro's growth. Chinese banks were selling the dollar yesterday, indirectly supporting the euro. The pair rose by 54 points and reached the intermediate level of 1.0971 on the way to 1.1000. The Marlin oscillator is currently turning downwards, and if the euro does not receive any more external support, the correction may end. Today, Federal Reserve Chair Jerome Powell is also speaking at the same conference in Portugal, and he could say something in favor of the dollar. If not, the price will continue to rise towards the corrective target at 1.1000. If the price surpasses this level, it will continue to rise towards targets at 1.1028 and 1.1085. 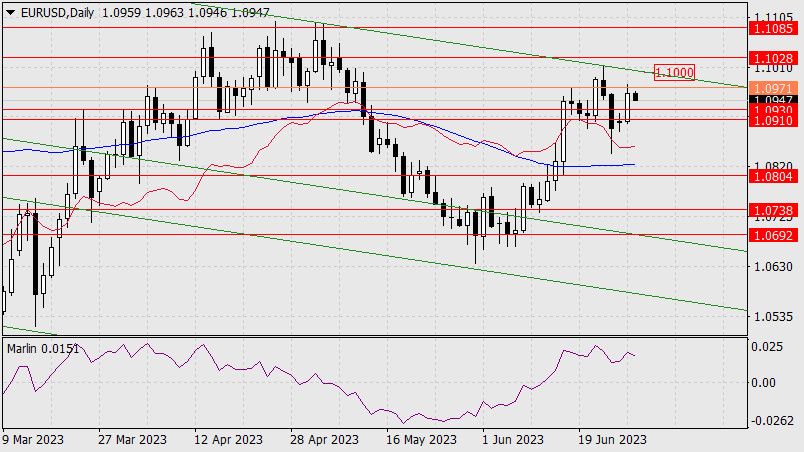 On the 4-hour chart, the price is entangled in indicator lines and has not yet fully figured out its relationship with the 1.0971 level. The Marlin oscillator only moved into positive territory yesterday, feeling fresh and ready to assist in further price growth. Falling below the target range of 1.0910/30 will restore the decline in the medium term, which started on June 22. The target is 1.0804. 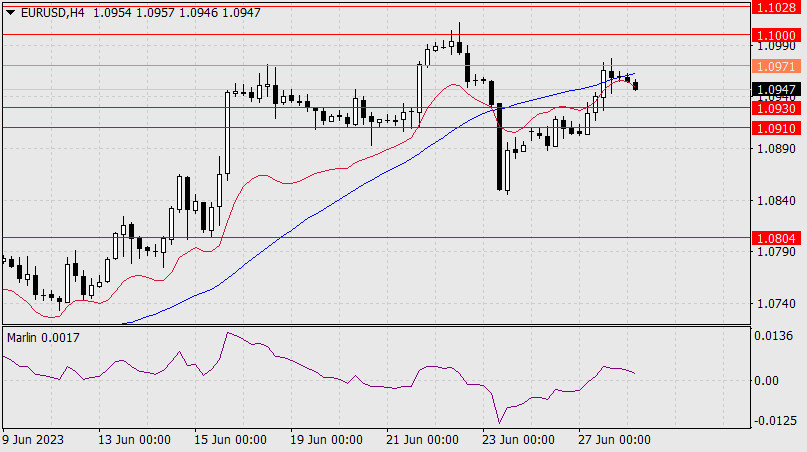 Analysis are provided by InstaForex.Read More Analysis are provided by InstaForex.Read More
|
|
|
|
Post by instaforexgertrude on Jun 29, 2023 0:38:47 GMT -5
Forecast for EUR/USD on June 29, 2023EUR/USD Yesterday, the euro returned to Tuesday's lows, which can be considered as the end of the confrontation amid aggressive rhetoric from central bank officials at the forum in Sintra. Federal Reserve Chairman Jerome Powell confirmed the possibility of rate hikes at consecutive meetings, and investors, comparing economic data that is clearly better in the United States than in Europe, started buying dollars. 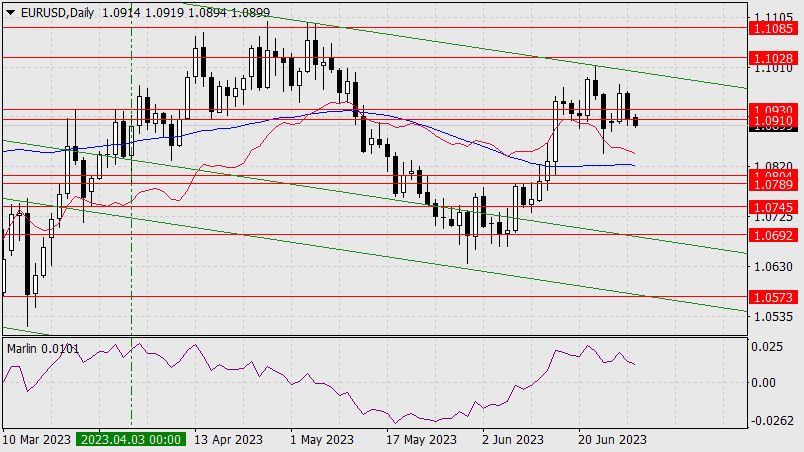 The price has already broken below the lower band of the target range of 1.0910/30 and opened the target of 1.0789-1.0804, towards which the MACD indicator line on the daily chart will soon approach. The lower band of the target range is defined by the low of April 3. The Marlin oscillator is declining. 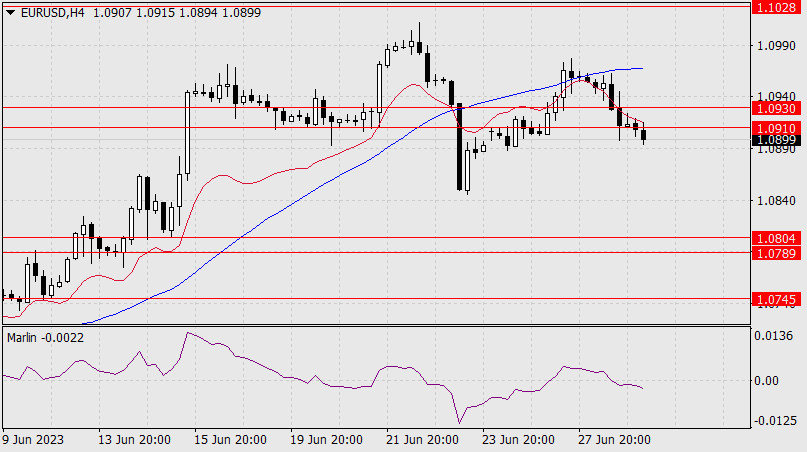 On the four-hour chart, the price has settled below the balance indicator line, and the Marlin oscillator has settled below the zero line. We have a downtrend, and we are waiting for the price to reach the target range. Analysis are provided by InstaForex.Read More
|
|
|
|
Post by instaforexgertrude on Jun 29, 2023 23:04:52 GMT -5
Forecast for EUR/USD on June 30, 2023EUR/USD: Yesterday, thanks to the report on the final estimate of US GDP for the first quarter, which turned out to be better than expected, the US dollar strengthened by 0.35%. The euro lost 47 pips. On the daily chart, the price settled below the range of 1.0910/30. Now the price can reach the target range of 1.0789-1.0804. 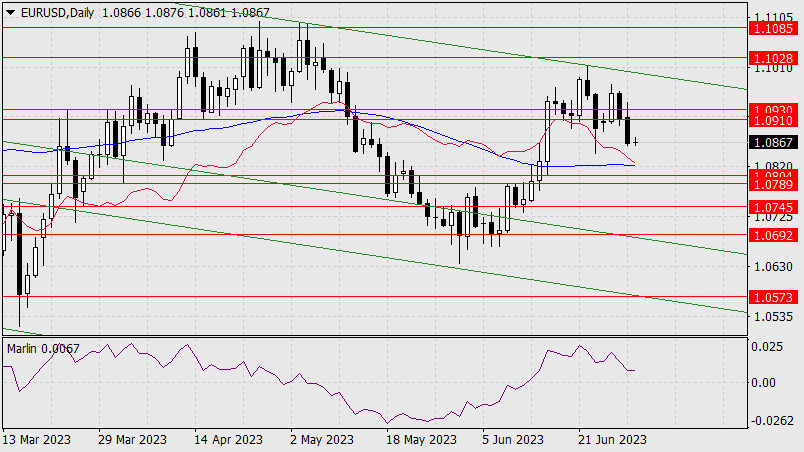 The MACD line is approaching this range, increasing its importance. Consolidating below this range will be a key indicator of the euro's medium-term uptrend. Around the same time, the Marlin oscillator will move into negative territory. 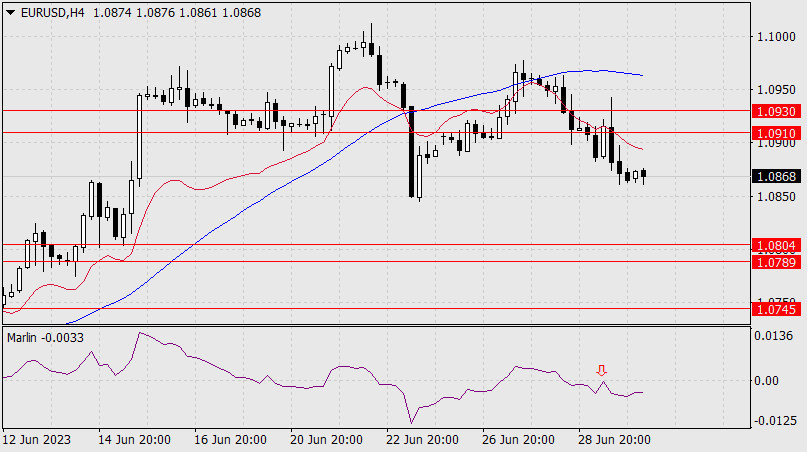 On the four-hour chart, the Marlin oscillator signal line stayed within the downtrend area yesterday. The price briefly moved above the range and the balance line. We expect further developments within the support range of 1.0789-1.0804. Analysis are provided by InstaForex.Read More
|
|
|
|
Post by instaforexgertrude on Jul 3, 2023 0:37:52 GMT -5
Forex Analysis & Reviews: Forecast for GBP/USD on July 3, 2023GBP/USD On Friday, the GBP/USD pair rose above the target level of 1.2678. The signal line of the Marlin oscillator turned upwards from the zero line. Now, if the pair closes the day above this level, it will continue to rise towards the next resistance level at 1.2785. Closing the day below 1.2678 will extend the period of uncertainty since the US will be celebrating a holiday tomorrow. 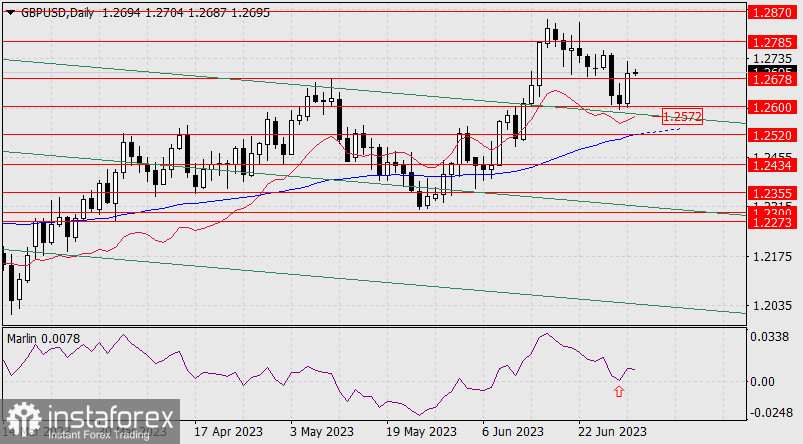 According to the main scenario, the price is trading towards the target support level at 1.2520, where the MACD line is currently located. This would automatically lead to a break below the embedded green price channel line (1.2572), which is a sign of medium-term decline. The pair will likely go through light trading today and tomorrow, due to the US holiday, and major events will unfold on Wednesday. 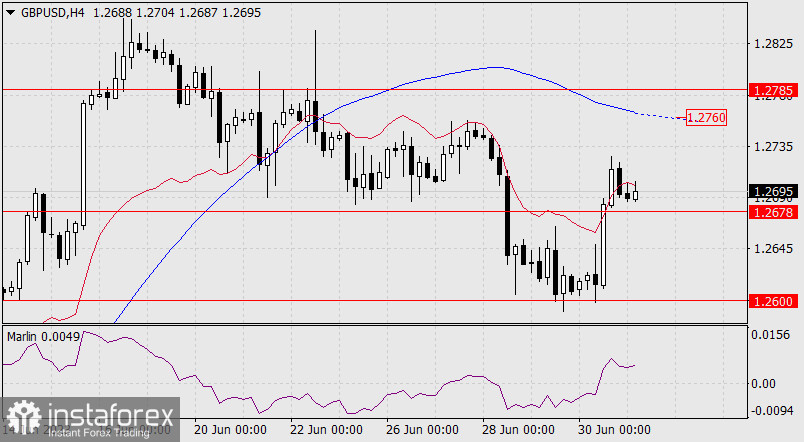 On the four-hour chart, the price is staying above 1.2678, and the first resistance it encounters is the balance indicator line. Marlin is rising in the positive territory. There is a possibility of further growth towards the MACD line (1.2760) and then 1.2785. Currently, time is working in favor of the bears. If the price fails to firmly establish above 1.2678 or reverses downwards, it may lead to a two-day period of uncertainty (range). Analysis are provided by InstaForex.Read More
|
|
|
|
Post by instaforexgertrude on Jul 4, 2023 0:04:57 GMT -5
Forecast for EUR/USD on July 4, 2023EUR/USD Yesterday, the euro showed a range of 60 points, closing the day at the opening level. The upper shadow tested the 1.0930 level, and this morning the price is headed towards this mark again, not giving up hope of reaching the upper band of the green descending price channel around 1.0990. This is possible if the euro follows the stock market and employment data turn out worse than expected. For now, the price needs to consolidate above 1.0930. Surpassing yesterday's low at 1.0871 will be a signal for a decline. 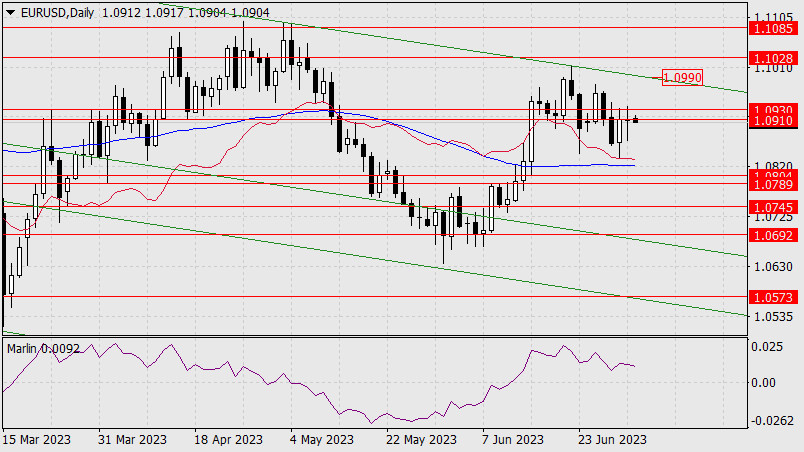 On the 4-hour chart, the price could not consolidate below the balance indicator line and returned to the 1.0910/30 range. Here, it can linger for a while and try to overcome the MACD line around 1.0952. The Marlin oscillator in the positive area is ready to join the growth at any moment. Given that we accept the bearish scenario for the euro as the main plan, the price may not overcome the MACD line and return below the range. Like yesterday, uncertainty persists in the short-term perspective. 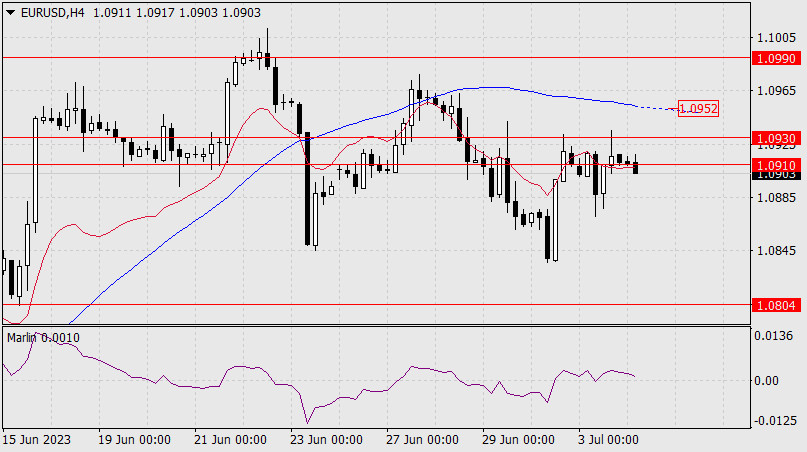 Analysis are provided by InstaForex.Read More Analysis are provided by InstaForex.Read More
|
|
|
|
Post by instaforexgertrude on Jul 4, 2023 23:28:40 GMT -5
Forecast for EUR/USD on July 5, 2023EUR/USD The euro lost more than 30 points yesterday, finding resistance at 1.0910/30 quite strong. The Marlin oscillator is not resisting this decline, it is approaching the border of the downtrend territory. Crossing this border will accelerate the pair's decline. There are two nearby targets: the MACD line (1.0820) and the target range under it at 1.0789-1.0804. 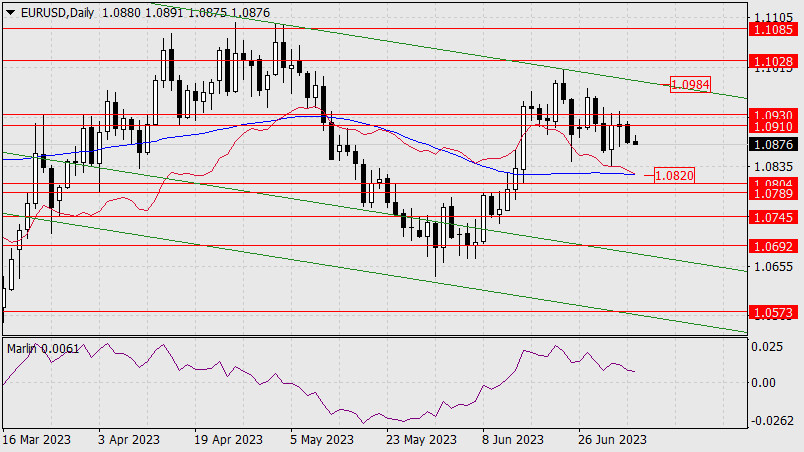 An alternative scenario will unfold with the price breaking above the resistance range of 1.0910/30, making the next target as 1.0984. On the four-hour chart, the price is falling below the balance and MACD indicator lines. The Marlin oscillator is also in decline territory. We are watching the development of the current downtrend. 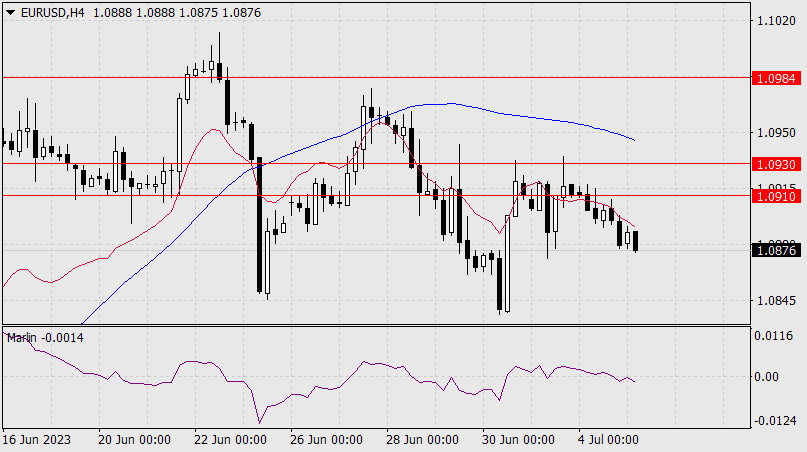 Today, the eurozone services PMI for May will be published - a decline from 55.1 to 52.4 is forecasted. In the US, the volume of industrial orders for May will be released, with growth of 0.8% expected. Analysis are provided by InstaForex.Read More
|
|
|
|
Post by instaforexgertrude on Jul 5, 2023 22:52:46 GMT -5
Forecast for USD/JPY on July 6, 2023USD/JPY For the sixth session, the yen has done nothing but move to the right. Such consolidation, however, increases the chances of an upward breakout, first to the target of 145.68, then to 147.40. The price's divergence with the Marlin oscillator is gradually losing strength due to inactivity. 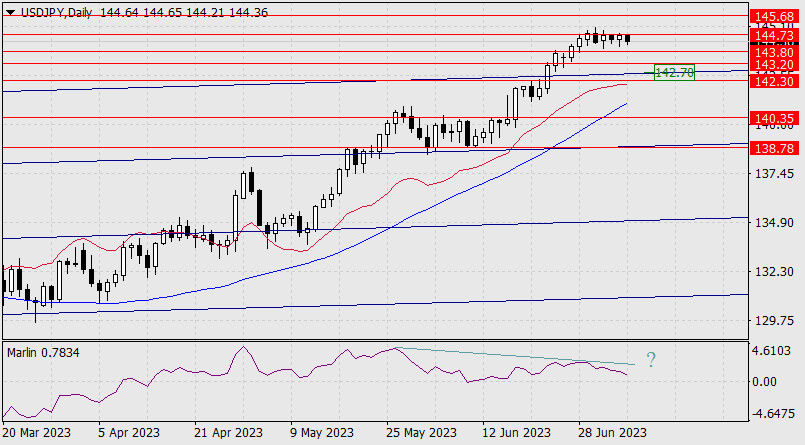 Now, even if the price falls to one of the support levels (143.80, 143.20), there will be a quick reversal. If the Marlin oscillator enters negative territory, which will not happen today, the price may fuel the corrective decline to the embedded line of the price channel around the 142.70 mark. 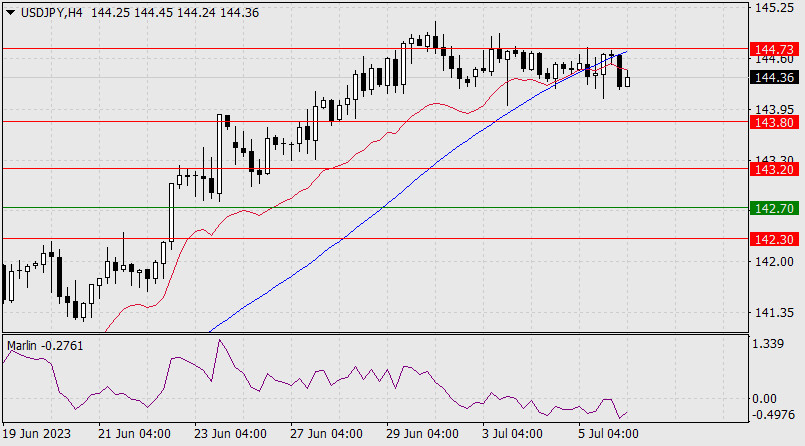 On the four-hour chart, the price fell under the balance and MACD indicator lines during the sideways movement. The price delay under these lines increases the chances of a decline. The Marlin oscillator is consolidating below the zero line – also a sign of a possible decline in the near future. Under the influence of external circumstances, the price may consolidate above 144.73 and this would point to upward movement. Analysis are provided by InstaForex.Read More
|
|
|
|
Post by instaforexgertrude on Jul 6, 2023 23:14:57 GMT -5
The Fed's minutes turned out to be somewhat unexpectedWednesday was a relatively quiet and calm day for the US currency. In the evening, the FOMC minutes were published, and this document, which usually only contains general information about the meeting, this time might have surprised the markets a bit. A month before the Federal Reserve's June meeting, the market was firmly convinced that the central bank would take a break for 1-2 meetings. After Fed Chair Jerome Powell spoke in the U.S. Congress and openly stated the possibility of two rate hikes in 2023, the chances of a rate hike in June increased. But it didn't increase for long or by much. A week later it dropped back down to 20% and remained there until the very meeting. 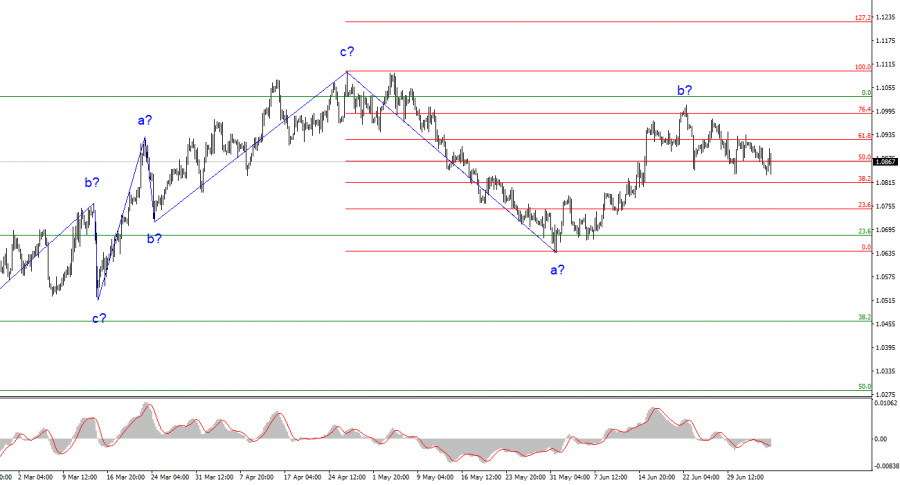 Therefore, there was no doubt that the rate decision was made long before the actual meeting, but, as it turned out last night, some FOMC members supported a new increase but simply found themselves in the minority. In my opinion, this is quite unexpected, as Powell in recent weeks instilled confidence in the existence of a unanimous opinion in the monetary committee. However, in any case, the document had a more hawkish stance, which could support the US currency. Since the demand for the greenback did not increase last night, and it sharply fell on Thursday morning, I conclude that the market did not find anything interesting for itself in the minutes, as often happens. Also take note of the fact that the majority of FOMC members support two more rate hikes this year, which fully coincides with the market's expectations. However, the minutes also state that uncertainty regarding the future of the US economy and inflation is too high, so additional data (future reports) would not be superfluous in determining the rate at subsequent meetings. If inflation continues to decline at a high pace, the rate may only rise once. The market is left with only two reports this week – Nonfarm Payrolls and Unemployment. A report on wages will be released on Friday, but I think that the market will focus on the first two reports. Thursday's release showed that the labor market is still in excellent condition, but the data from the ADP and Nonfarm Payrolls reports often differ from each other, even though they reflect roughly the same thing. Personally, I believe Friday's release will not disappoint, but various scenarios are possible. 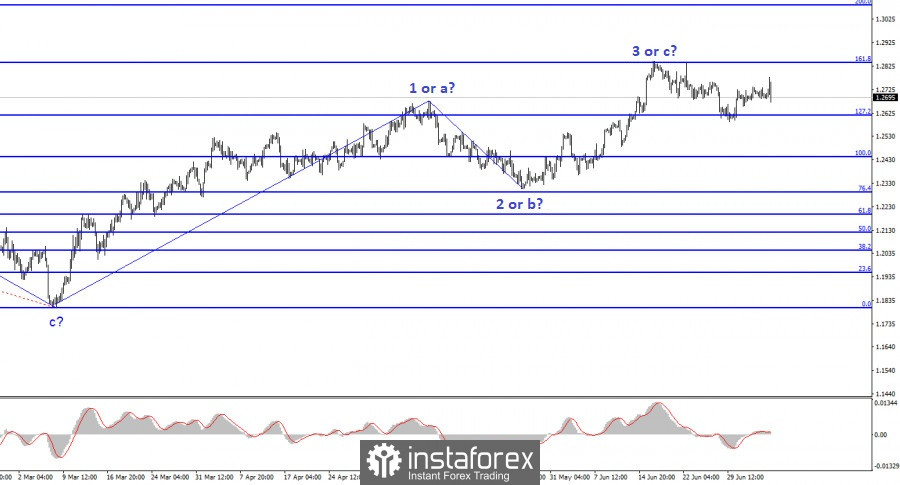 Based on the analysis conducted, I conclude that the downtrend is currently being built. The instrument has enough room to fall. I believe that targets around 1.0500-1.0600 are quite realistic. I advise selling the instrument on "down" signals from the MACD indicator. The wave b is apparently over. According to the alternative layout, the ascending wave will be longer and more complicated, this will be the main scenario in case of a successful attempt to break through the current peak of the wave b. The wave pattern of the GBP/USD instrument has changed and now it suggests the formation of an upward set of waves. Earlier, I advised buying the instrument in case of a failed attempt to break through the 1.2615 mark, which is equivalent to 127.2% Fibonacci. Wave 3 or c may take a more extended form, or wave e in a wedge will be constructed, and the instrument will return to the 1.2842 mark. Selling looks more promising and I advised it two weeks ago with a Stop Loss above 1.2842, but the signal from 1.2615 temporarily canceled that scenario. We need new signals for short positions. Analysis are provided by InstaForex.Read More
|
|
|
|
Post by instaforexgertrude on Jul 9, 2023 23:33:05 GMT -5
The dollar is covering its tracksFirst impressions can be deceiving. US non-agricultural employment rose by 209,000 in June fell short of the Bloomberg expert consensus forecast and was the weakest since December 2020. Moreover, the data for April and May were revised down by 110,000. Initially, the market perceived the report as weak, which led to a drop in Treasury bond yields and a rise in EUR/USD above 1.092. However, the devil is always in the details. In the lead-up to the report, investors were counting on strong numbers as private sector employment from ADP rose by nearly half a million people. However, the actual non-farm payrolls turned out to be worse than that report by the largest amount since the beginning of 2022. This fact can be seen as a sign of a cooling labor market. Nevertheless, unemployment in June dropped from 3.7% to 3.6%. As long as it does not increase, we can forget about a recession in the US economy. In addition, the average wage increased faster than expected, so it's still too early for the Federal Reserve to relax. U.S. private sector employment 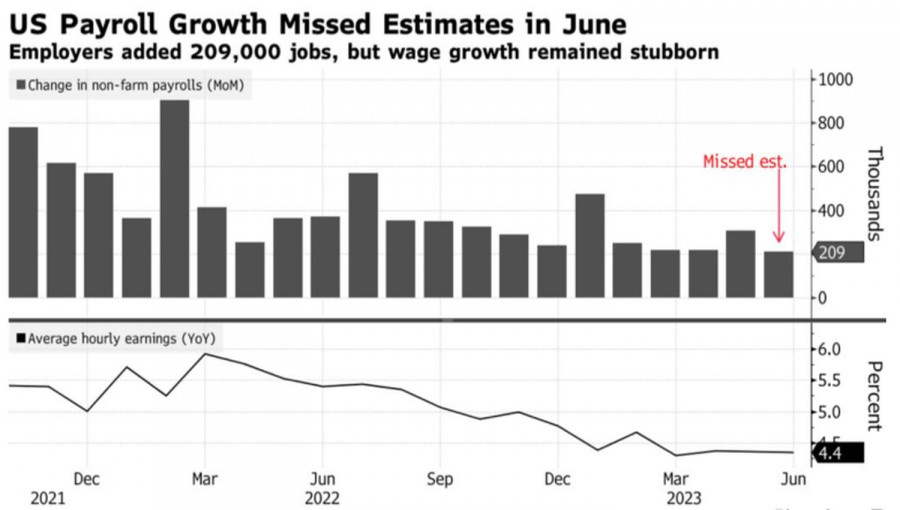 The employment report for the US private sector turned out to be mixed. It reduced the probability of a rate hike to 5.75% in 2023 from 41% to 36%, which worsened the position of the US dollar against the main world currencies. However, Deutsche Bank noted that only a figure of +100,000 or less for non-farm payrolls could change the worldview of FOMC officials and make them abandon their plans for two acts of monetary restriction this year. June employment data gave food for thought to both the "hawks" and "centrists" of the Fed, as well as the "bulls" and "bears" for EUR/USD. Now, investors' attention is shifting to US inflation data and Fed Chair Jerome Powell's speech in Jackson Hole. Bloomberg experts expect consumer prices to slow in June from 4% to 3.1%, and core inflation from 5.3% to 5% year-on-year. CPI is moving so quickly towards the 2% target that it's as if Fed officials have not changed their minds. Could it be that this time the financial market will be right? And those who went against the Fed will make money? We'll see. 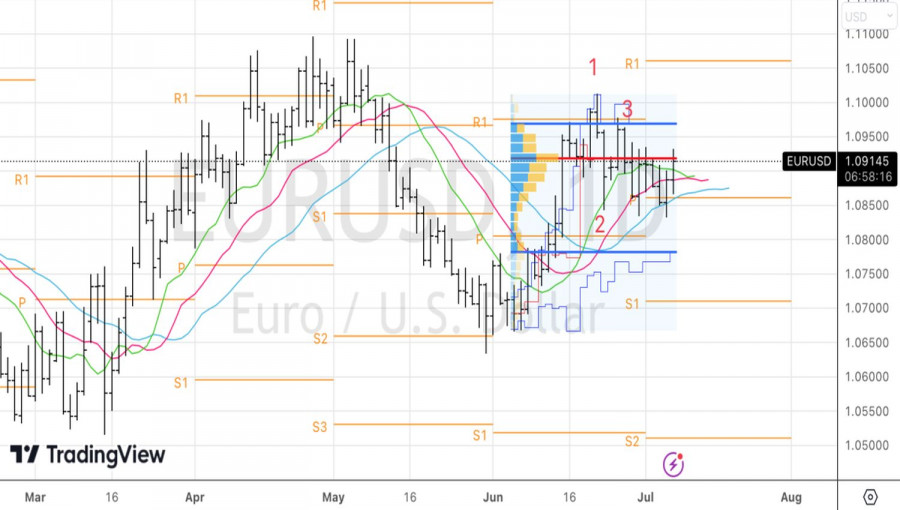 Not everyone agrees with this. ING notes that the minutes of the FOMC's June meeting set a very high bar for incoming data for the Bank to abandon its plans. The US labor market report is unlikely to have surpassed this bar. Core inflation continues to remain high, and the economy is firmly on its feet. All this allows ING to predict the EUR/USD pair's fall towards 1.08 within the next week. Technically, on the daily chart, there is a battle for the fair value at 1.092. Closing above this level will allow you to buy on a breakout of resistance at 1.0935. This is where the upper band of the consolidation range within the "Spike and Ledge" pattern is located. On the contrary, if the 1.092 mark persists for the bears, we will sell the euro from $1.089. Analysis are provided by InstaForex.Read More
|
|
|
|
Post by instaforexgertrude on Jul 11, 2023 1:47:46 GMT -5
Technical Analysis of EUR/USD for July 11, 2023Technical Market Outlook: The EUR/USD pair has broken above the intraday technical resistance seen at the level of 1.0974 and made a new swing high at the level of 1.1023 (at the time of writing the analysis). The intraday technical support is seen at the level of 1.0974. Please notice, the momentum has hit the extremely overbought conditions again, so there is a confirmation of the bearish pressure on the lower time frame charts. In a case of a breakout lower, the next target for bears is seen at the level of 1.0901 and 1.0876. Only a sustained breakout below the moving average dynamic support around 1.0900 would change the outlook to more negative. 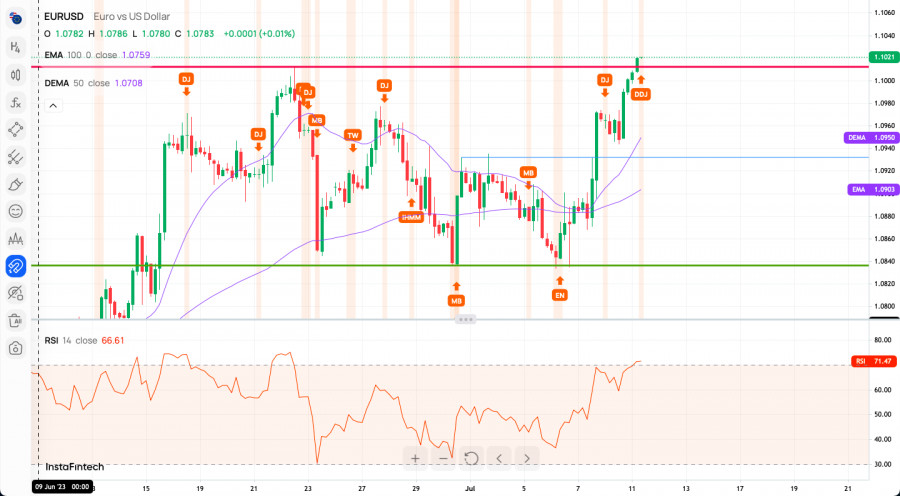 Weekly Pivot Points: WR3 - 1.09927 WR2 - 1.09761 WR1 - 1.09665 Weekly Pivot - 1.09595 WS1 - 1.09499 WS2 - 1.09429 WS3 - 1.09263 Trading Outlook: Since the beginning of October 2022 the EUR/USD is in the corrective cycle to the upside, but the main, long-term trend remains bearish. This corrective cycle might had been terminated at the level of 1.2080 which is 61% Fibonacci retracement level. The EUR had made a new multi-decade low at the level of 0.9538, so as long as the USD is being bought all across the board, the down trend will continue towards the new lows. Analysis are provided by InstaForex.Read More
|
|
|
|
Post by instaforexgertrude on Jul 11, 2023 23:24:32 GMT -5
Forecast for EUR/USD on July 12, 2023EUR/USD The euro has reached the target resistance of 1.1028. The pair has crossed the peak of June 22, and along with it, the primary conditions for forming divergence with the Marlin oscillator have been prepared. If a divergence is formed, it will mean the end of the entire corrective growth since May 31. If the price consolidates above 1.1028, it could extend this correction to 1.1085, that is, to its limit as a correction. But if the pair surpasses this level, it will mean the continuation of the entire uptrend from September 25, 2022. However, this growth also has a small chance of a build-up, its first resistance level is 1.1155. 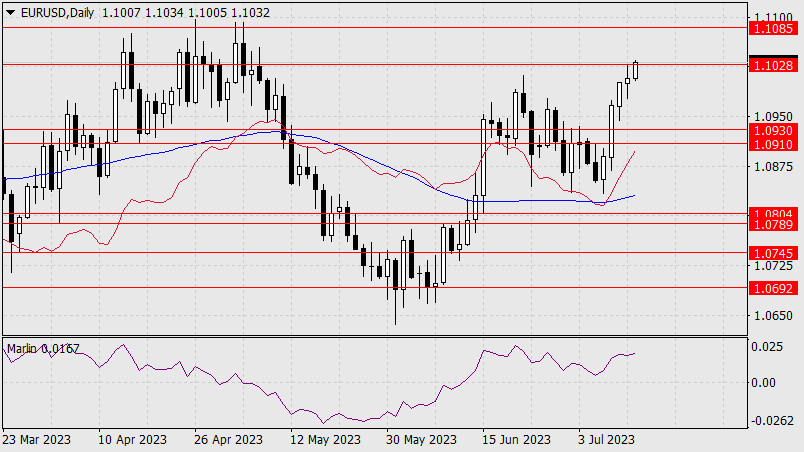 oday, the June CPI data will be published in the United States. The total CPI is forecasted to fall from 4.0% y/y to 3.1% y/y, and the core CPI is expected to decrease from 5.3% y/y to 5.0% y/y. As the previous rise from July 6 was purely speculative, the market reaction to the data could even be against the data. This means that if the current market logic implies a softening of the Federal Reserve's policy in connection with forecasts for today's data, then the actual reaction could be the opposite (falling euro), as a cumulative view on the deterioration of the European economy and the resilience of the American one. It is also notable that the market ignored yesterday's drop in the European ZEW Economic Sentiment Index for July from -10.0 to -12.2. 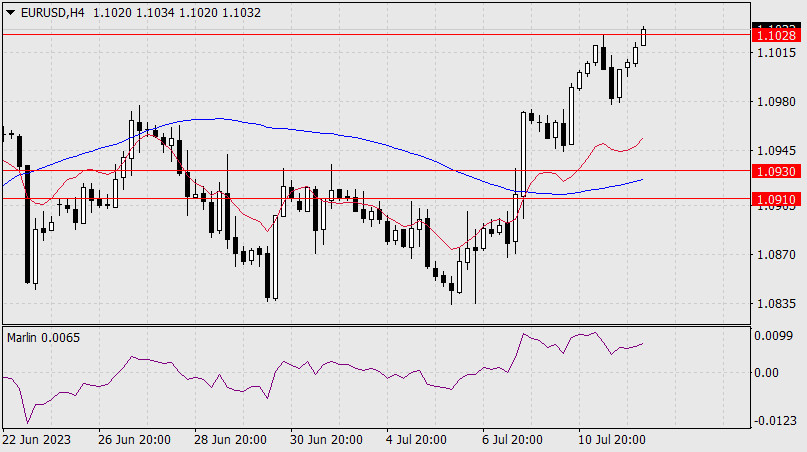 On the four-hour chart, the Marlin oscillator is developing sideways movement in its own range. This is a sign of increasing potential for a downward movement. All we have to do is wait for the US inflation report and look at the market reaction. Analysis are provided by InstaForex.Read More
|
|
|
|
Post by instaforexgertrude on Jul 12, 2023 23:50:12 GMT -5
Forecast for EUR/USD on July 13, 2023EUR/USD Yesterday's US inflation data came out better than forecasts; the core CPI for June fell from 5.3% YoY to 4.8% YoY, the overall CPI fell by 1.0% - from 4.0% YoY to 3.0% YoY. The euro surpassed the April peak and closely approached the target level of 1.1155. Now the price has revived the uptrend from September 25, 2022. After overcoming 1.1155, the next target will be 1.1222 (the support level from December 7-15, 2022). 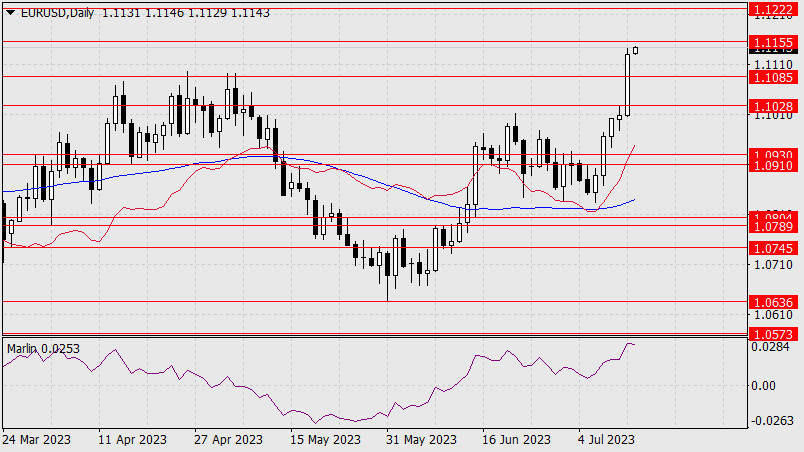 The pair may not surpass the 1.1155 mark today, but after a slight pullback to the nearest support level of 1.1085. The reason may be the slowdown in the growth rate of industrial production in the eurozone - the forecast for May is -1.1% YoY against 0.2% YoY in April. 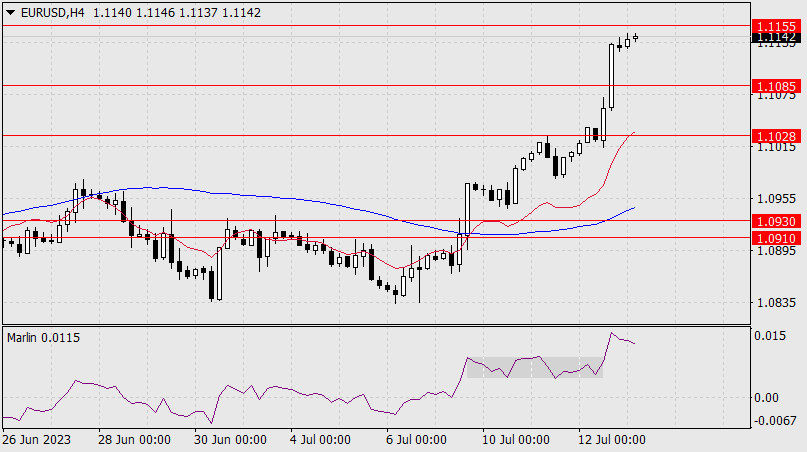 On the four-hour chart, the signal line of the Marlin oscillator has left the consolidation and moved upwards, and immediately into the overbought territory. This is also a sign of an impending pullback before the price rises further. Analysis are provided by InstaForex.Read More
|
|
|
|
Post by instaforexgertrude on Jul 14, 2023 1:27:51 GMT -5
Elliott wave analysis of EUR/USD for July 14, 2023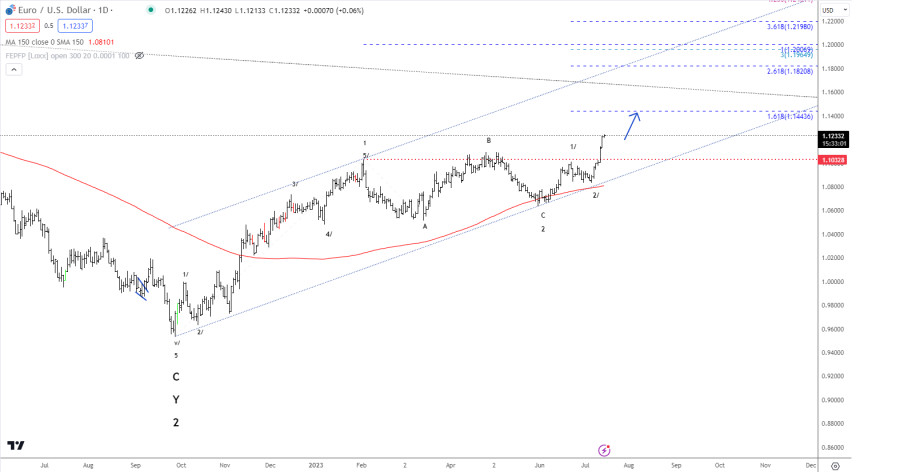 EUR/USD continues to rally higher towards the next upside target at 1.1444. In the longer term, we are looking for EUR/USD to move closer to the 1.2007 target as a minimum. Short-term support is seen near 1.1130 with solid support placed at 1.1033, which previously acted as resistance, but now, has shifted character to support after the clear break on Wednesday. In the short term, we could see the pace of the rally settle down, but the bias will remain towards the upside. Analysis are provided by InstaForex.Read More
|
|
|
|
Post by instaforexgertrude on Jul 16, 2023 23:27:23 GMT -5
Forecast for EUR/USD on July 17, 2023EUR/USD Last Friday, as well as in today's Asian session, the euro started to show signs of reversal from the resistance level at 1.1237. We can confirm this when the price falls below Friday's low at 1.1205. This would allow it to continue falling towards the first support level at 1.1155. 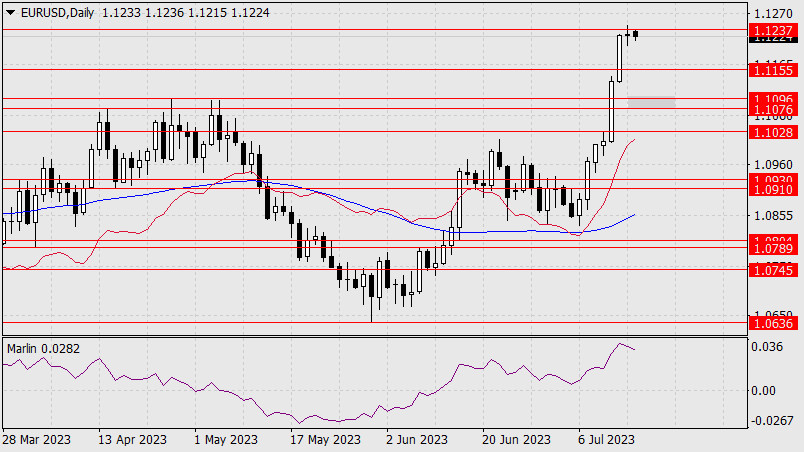 Further, we might witness a breakthrough below this mark and test the 1.1076/96 range. Consolidating below this target range would serve as a strong signal for a reversal. However, this would need to be confirmed as well. The signal line of the Marlin oscillator is turning downwards, indicating a high probability of the price decline, at least as a correction towards 1.1155. 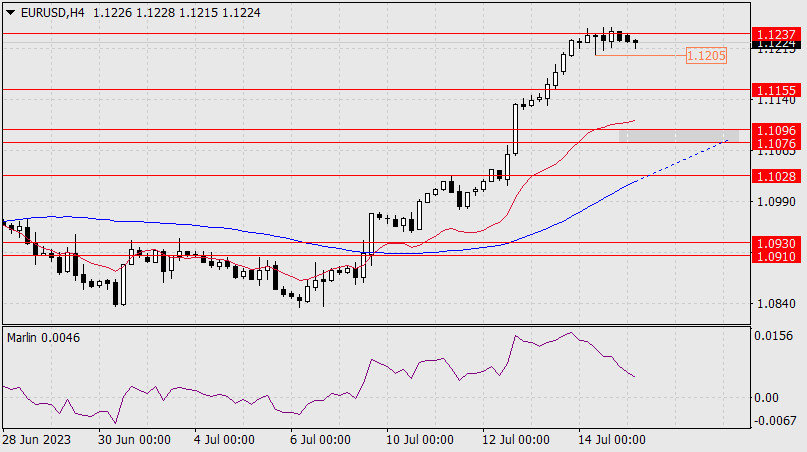 On the 4-hour chart, the Marlin oscillator is swiftly approaching the boundary of the bearish territory, indicating the price's intention to test 1.1155. The MACD line is heading towards the target range at 1.1076/96, strengthening it and increasing its strategic significance. Analysis are provided by InstaForex.Read More
|
|
|
|
Post by instaforexgertrude on Jul 17, 2023 23:56:33 GMT -5
Forecast for EUR/USD on July 18, 2023EUR/USD: The euro closed Monday's session at the opening level below the resistance at 1.1237. This morning, the price rose higher than yesterday's high and formally opened the target at 1.1320. 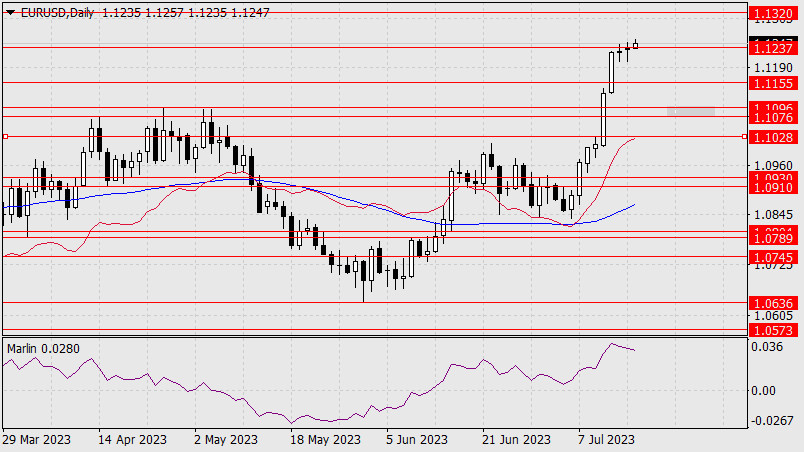 Speculative growth of the euro continues, but it will eventually come to an end, maybe today, as the US will release its retail sales report for June, with an optimistic forecast of 0.5% compared to 0.3% in May. The Marlin oscillator does not react to the price increase; it continues to fall. The upward movement may turn out to be deceptive. 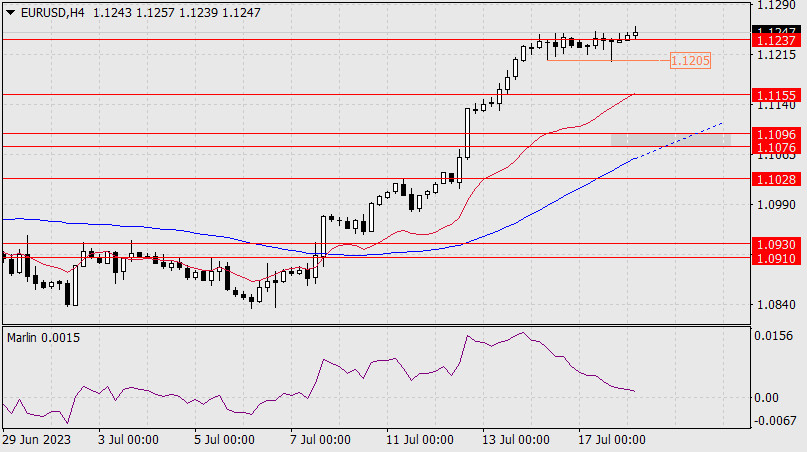 On the four-hour chart, Marlin also does not respond to the recent price growth. Yesterday, the pair failed to break through the key level of 1.1205; it retains its role today as well. Overcoming this level will open the next target at 1.1155. Breaking below 1.1155 opens up the key range of 1.1076/96. Analysis are provided by InstaForex.Read More
|
|